Powell Comments Push Markets

Good Morning Traders,
As of this writing 4 AM EST, here’s what we see:
US Dollar: Sept. USD is Up at 94.995.
Energies: Aug '18 Crude is Down at 66.74.
Financials: The Sept 30 year bond is Down 1 tick and trading at 145.00.
Indices: The Sept S&P 500 emini ES contract is 12 ticks Higher and trading at 2814.25.
Gold: The Aug gold contract is trading Down at 1223.60 Gold is 37 ticks Lower than its close.
Initial Conclusion
This is not a correlated market. The dollar is Up+ and Crude is Down- which is normal but the 30 year Bond is trading Lower. The Financials should always correlate with the US dollar such that if the dollar is lower then bonds should follow and vice-versa. The S&P is Higher and Crude is trading Lower which is correlated. Gold is trading Down- which is correlated with the US dollar trading Higher. I tend to believe that Gold has an inverse relationship with the US Dollar as when the US Dollar is down, Gold tends to rise in value and vice-versa. Think of it as a seesaw, when one is up the other should be down. I point this out to you to make you aware that when we don't have a correlated market, it means something is wrong. As traders you need to be aware of this and proceed with your eyes wide open.
At this hour Asia is trading Mixed with half the exchanges trading Higher and the other half Lower. As of this writing Europe is trading Mixed as well.
Possible Challenges To Traders Today
-
Building Permits are out at 8:30 AM EST. This is major.
-
Housing Starts are out at 8:30 AM EST. This is major.
-
Fed Chair Powell Testifies at 10 AM EST. This is major.
-
Crude Oil Inventories are out at 10:30 AM EST. This is major.
-
Beige Book is out at 2 PM EST. This is major.
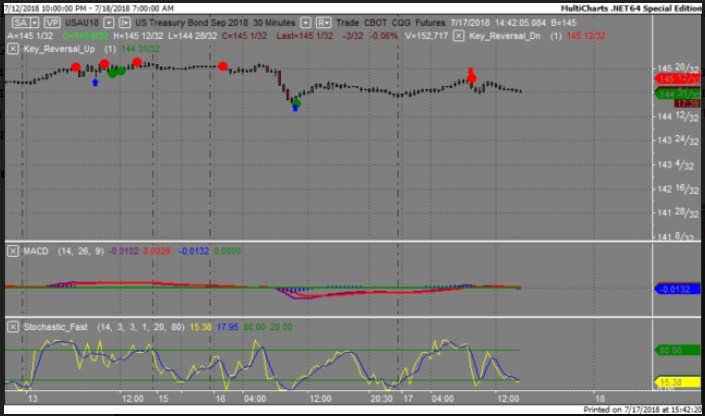
Treasuries
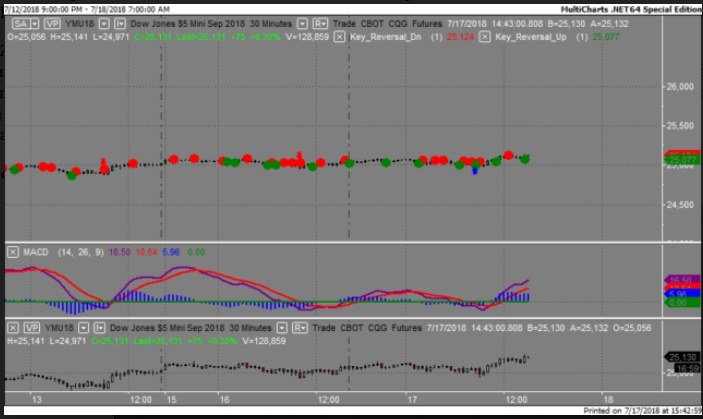
We've elected to switch gears a bit and show correlation between the 30 year bond (ZB) and The YM futures contract. The YM contract is the DJIA and the purpose is to show reverse correlation between the two instruments. Remember it's liken to a seesaw, when up goes up the other should go down and vice versa.
Yesterday the ZB made it's move at around 8:30 AM EST. The ZB hit a High at around that time and the YM hit a Low. If you look at the charts below ZB gave a signal at around 8:30 AM EST and the YM was moving Higher at the same time. Look at the charts below and you'll see a pattern for both assets. ZB hit a High at around 8:30 AM and the YM was moving Higher at the same time. These charts represent the newest version of MultiCharts and I've changed the timeframe to a 30 minute chart to display better. This represented a shorting opportunity on the 30 year bond, as a trader you could have netted about a dozen ticks per contract on this trade. Each tick is worth $31.25.
Charts Courtesy of MultiCharts built on an AMP platform.
Bias
Yesterday we gave the markets a Neutral bias as the indices didn't seem to have any sense of direction Tuesday morning. The Dow gained 55 points and the other indices gained ground as well. Today we aren't dealing with a correlated market and our bias is to the Upside.
Could this change? Of Course. Remember anything can happen in a volatile market.
Commentary
Tuesday morning the markets seemed glued to hear what Fed Chair Powell would say in his testimony to the Congressional Finance Committee. For the first time ever a Fed Chair publicly stated that raising interest rates would be the correct course of action at this time. I believe that the markets at the very least liked to definitive stance which is something they haven't seen in awhile. The Dow rose by 55 points, the S&P by 11 and the Nasdaq by 49. Today we have a continuation of Powell's testimony and will await those comments as well.
Author

Nick Mastrandrea
Market Tea Leaves


