Plunge in Interbank Lending: The Straw that Broke the Fed's Back

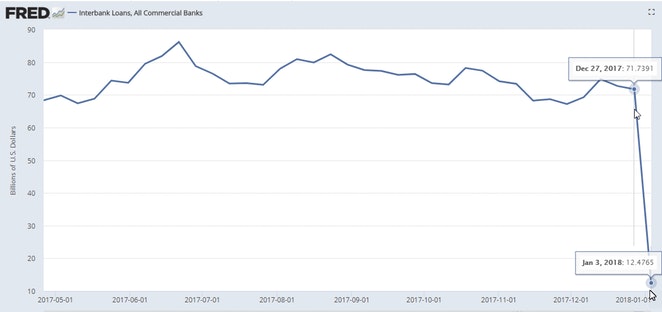
Interbank lending took a historic dive. Readers ask "What's happening?" Let's investigate.
Interbank Lending Long Term
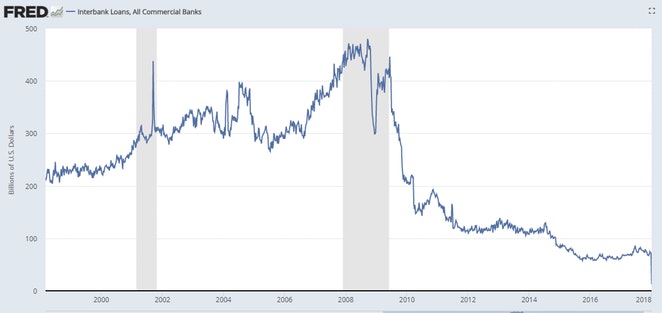
The plunge in interbank lending is both sudden and dramatic. What's going on?
Fed Tightening Two Ways
The short answer is a straw broke the Fed's back.
A more robust explanation is the Fed is tightening two ways: The first by hiking, the second by letting assets on the balance sheet roll off.
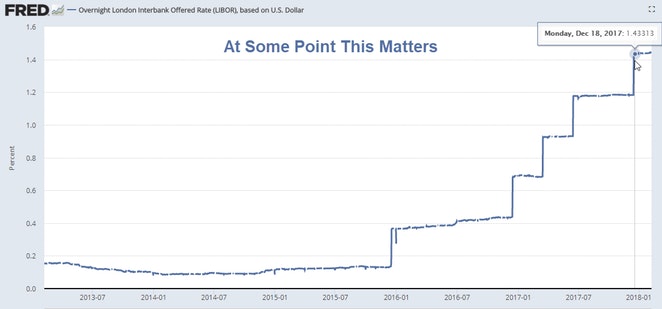
Both measures have a tendency to push up long-term interest rates. This is another explanation for the long-end rising. Despite conventional wisdom, inflation and wages have little to do with it.
We can see the effect in other charts.
LIBOR
Year-Over-Year M2 Growth
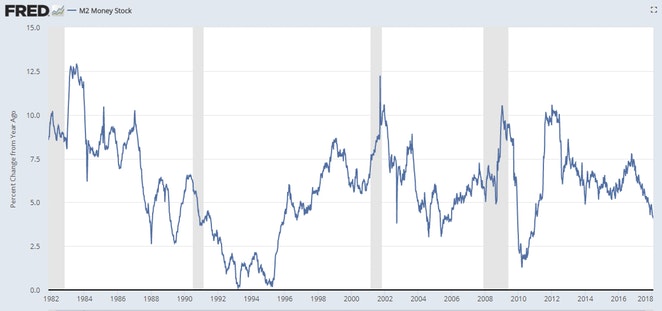
Money supply growth is falling as are excess reserves.
Excess Reserves
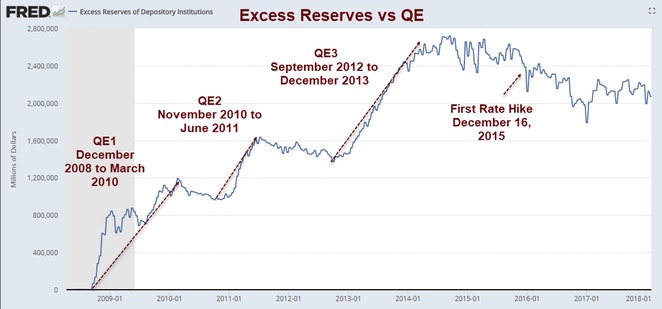
The Fed started balance sheet reduction in October of 2017. Unwinding the balance sheet escalates greatly in 2018.
- The treasury unwind started at $6 billion per month, increasing by $6 billion at three-month intervals over 12 months until it reaches $30 billion per month.
- The mortgage debt unwind started at $4 billion per month, increasing in steps of $4 billion at three-month intervals over 12 months until it reaches $20 billion per month.
Does the Fed Know What It's Doing?
Janet Yellen answered that question directly in her speech A Challenging Decade and a Question for the Future, at the Herbert Stein Memorial Lecture National Economists Club on October 20, 2017.
The FOMC does not have any experience in calibrating the pace and composition of asset redemptions and sales to actual and prospective economic conditions. Indeed, as the so-called taper tantrum of 2013 illustrated, even talk of prospective changes in our securities holdings can elicit unexpected abrupt changes in financial conditions.
Given the lack of experience with reducing our asset holdings to scale back monetary policy accommodation and the need to carefully calibrate the removal of accommodation, the FOMC opted to allow changes in the Federal Reserve's securities holdings to play a secondary role in the Committee's normalization strategy. Rather than balance sheet shrinkage, the FOMC decided that its primary tool for scaling back monetary policy accommodation would be influencing short-term interest rates.
So the Fed held off, and off, and off. Until now.
Rate Hikes vs. Balance Sheets
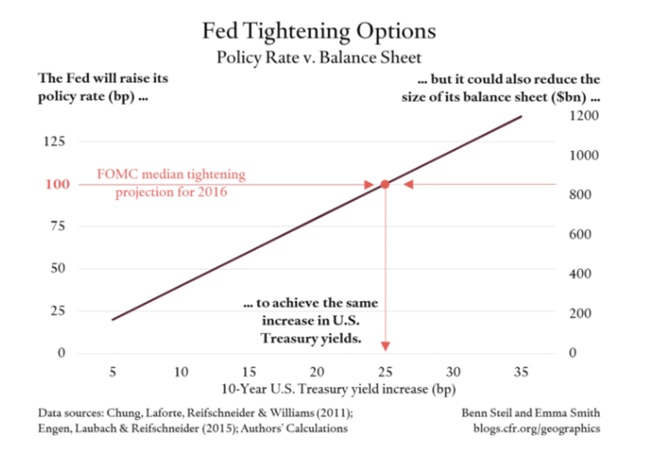
In a Foreign Affairs article on February 2, 2016, Benn Steil and Emma Smith discussed Rate Hikes vs. Balance Sheets.
The Fed’s accumulation of longer-term U.S. Treasuries has been a big source of demand and has therefore lowered the term premium on longer-term Treasuries. (Former Federal Reserve Chairman Ben Bernanke explains this well on his blog.) Fed economists estimate that yields on ten-year Treasury bonds would be around 70 basis points higher than their current level of around 2 percent had the Fed not bought such bonds to begin with.
In short, when the Fed buys and sells bonds, it affects the interest rates on such bonds. So does the Fed pushing the Fed funds rate up or down. As a rough guide, a rate hike of 100 basis points is historically associated with a 25-point rise in ten-year Treasury yields.
The Fed expects to raise the Fed funds rate about 100 basis points, from the current rate of 0.375 percent, over the course of the coming year. This should, then, be expected to push up ten-year Treasury yields by about 25 basis points. The numbers above suggest that the Fed could achieve the same rise in ten-year Treasury yields by letting its maturing bonds roll off and selling an additional $600 billion worth.
Fed Tightening More Than It Realizes
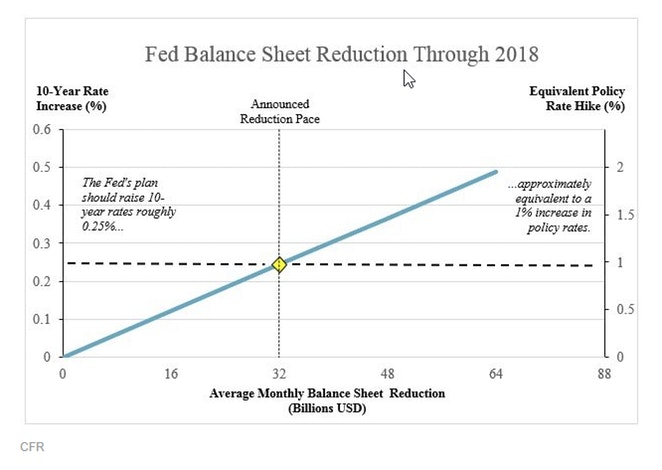
On November 12, Benn Steil and Benjamin Della Rocca wrote the Fed Could be Tightening More Than it Realizes.
The Federal Reserve has no experience shrinking its balance and ending quantitative easing
Raising interests rates and shrinking the balance sheet could work in tandem to tighten monetary policy more than the Fed expects.
This could mean much slower than expected economic growth.
In Fed Chair Janet Yellen’s words, the central bank "does not have any experience in calibrating the pace and composition of asset redemptions and sales to actual prospective economic conditions." She has therefore stressed that the Fed sees its balance-sheet reduction as a primarily technical exercise separate from the pursuit of its monetary policy goals—in particular, pushing inflation back up to 2%.
Yellen acknowledges that reducing the balance sheet now is, logically, a substitute for raising the Fed’s policy rate. More of one should, therefore, mean less of the other, and vice- versa. But what are the trade-offs?
On the basis of those Fed-economist estimates above, we calculate that the Fed’s plan to reduce the balance sheet by $450 billion from this October through the end of 2018 (a monthly average of about $32 billion) is roughly equivalent to a one percent hike in the policy rate—as we illustrate in the figure below. This equivalence means that the effective federal funds rate at the end of 2018 should be a full percentage point lower than it would be without the balance-sheet reduction. That’s a big number.
Does the market realize this? Does the Fed? The data suggest not. The Fed announced its plans for balance-sheet reduction back in June. Since then, market estimates of the effective federal funds rate through 2019 have moved little from pre-announcement levels, and in fact have risen slightly—as we show below. Likewise, the “dot plot” rate projections of Federal Open Market Committee members have hardly budged since the end of last year. Unless both the market and the Fed suddenly became vastly more sanguine about growth prospects at the time of the announcement, these facts suggest that they are largely ignoring — and therefore greatly underestimating—the tightening impact of the balance-sheet reduction.
What does this mean, going forward? It means that the Fed is likely to push rates higher than they should over the coming year. And if that is right, the risks of slower-than-expected growth are also higher.
A Straw or a Brick?
A number of things that have happened recently that can be considered straws, but the combined effect is more like a brick.
- Increasing number of rate hikes and rate hike expectations
- Balance sheet tapering, which is an effective rate hike.
- Repatriation of tax dollars puts upward pressure on rates.
- Mortgage rates are at 4-year highs. This will pressure housing.
- Money supply growth is decelerating.
- Trump tax cuts add to the deficit.
Interbank Lending
Those are the things that I believe caused a plunge in interbank lending and also contributed to the VIX selloff. Take your choice as to which one was the "straw".
Note on Hikes
I do not suggest the Fed is hiking too much. Rather, we should not be in this place at all.
The Fed, starting with Alan Greenspan, created a series of bubbles, each of bigger magnitude than the one that preceded it.
Eventually bubbles pop, no matter what the Fed does.
Economic Growth Will Hit Brick Wall
Those who believe the economy is about to lift off have it ass backward. The economy is on its final legs. The kicker to this mess is hedge funds and small speculators are record short treasury futures.
Just as record numbers of people bought into stocks in December and January, a record number of people have been shorting treasuries expecting an economic lift-off that is far away in the rear-view mirror.
The next big move in interest rates is down.
Author

Mike “Mish” Shedlock's
Sitka Pacific Capital Management,Llc
Mike “Mish” Shedlock is a registered investment advisor for SitkaPacific Capital Management.


