Patterns: USD/THB, USD/SGD
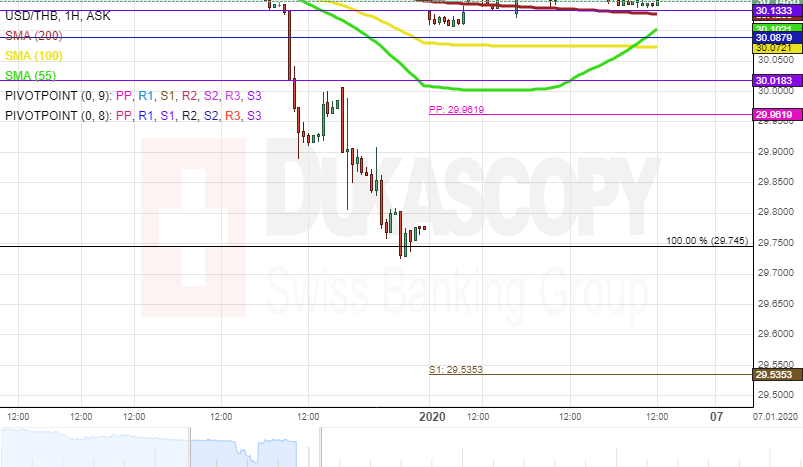
USD/THB 1H Chart: Bulls could prevail
After significant drop to the 29.75 level, the USD/THB exchange rate managed to jump to the 30.15 mark. Currently, the rate is testing the resistance level formed by the monthly R1 at 30.20.
Note that the currency pair is supported by the 55-, 100– and 200-hour moving averages in the 30.10 area. Thus, it is likely that some upside potential could prevail in the market, and the pair could reach the 30.40 level.
However, if the given resistance level holds, it is likely that a reversal south could occur in the nearest future. In this case the exchange rate could re-test the 29.75 level.
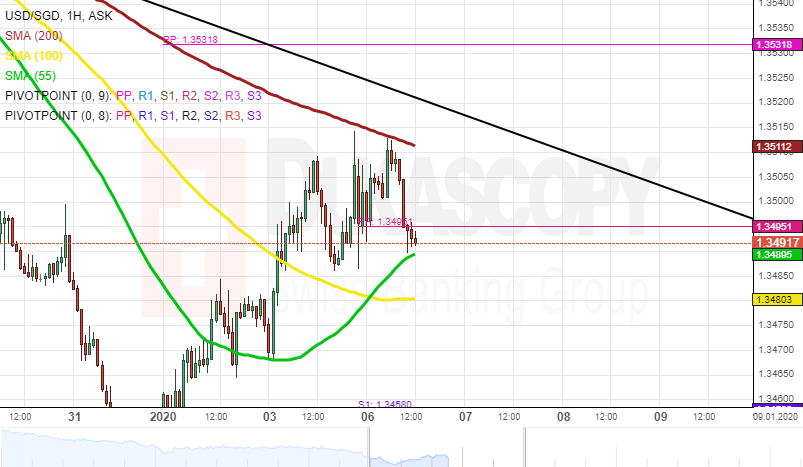
USD/SGD 1H Chart: Two scenarios likely
The US Dollar continued to depreciate against the Singapore Dollar within the falling wedge pattern (4H time-frame chart). The USD/SGD currency pair reversed north from the lower pattern line at the end of December.
From a theoretical point of view, it is likely that a breakout north could occur in the nearest future. In this case the exchange rate could target the psychological level at 1.3600.
However, note that the currency pair is pressured by the 200-hour moving average, currently located at 1.3512. Thus, it is likely that the pair could breach the given pattern south. In this case, the pair could gain support of the Fibo 23.60% at 1.3414.
Author

Dukascopy Bank Team
Dukascopy Bank SA
Dukascopy Bank stands as an innovative Swiss online banking institution, with its headquarters situated in Geneva, Switzerland.


