Patterns: USD/THB, USD/SGD
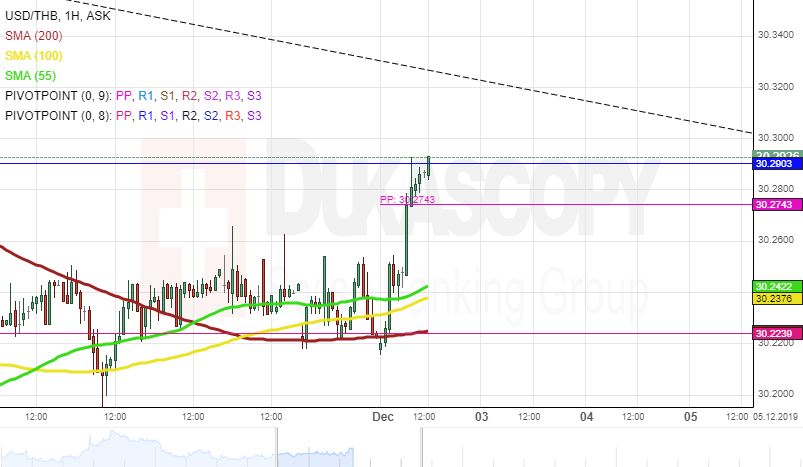
USD/THB 1H Chart: Falling wedge pattern in sight
The USD/THB exchange rate continued to trade downwards within the falling wedge pattern. As apparent on the chart, the rate is testing the upper pattern at 30.29.
From a theoretical point of view, it is likely that a reversal south could occur within the following trading sessions, and the currency pair could continue to trade within the given pattern. Important levels to look out for is the monthly S2 and S3, located at 29.99 and 29.82 respectively.
However, note that the exchange rate is supported by the 55-, 100– and 200-hour moving averages. Therefore, if the given pattern does not hold, the rate could extend gains in the nearest future. In this case the pair could face the resistance of the monthly R1 at 30.39.
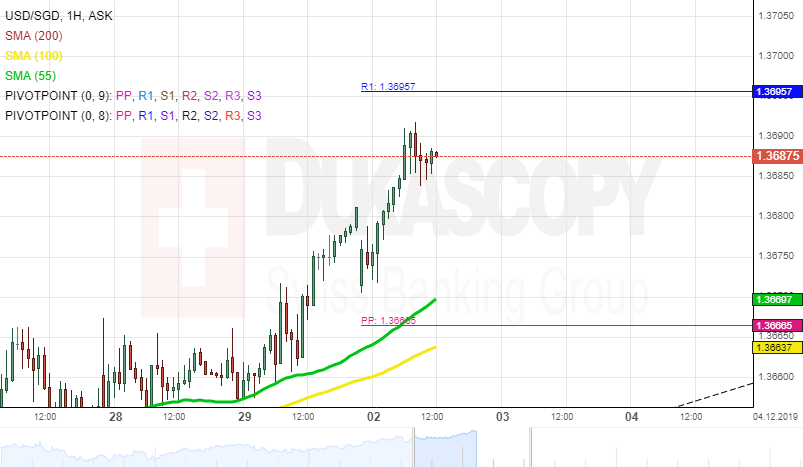
USD/SGD 1H Chart: Short-term increase expected
The US Dollar has been appreciating against the Singapore Dollar since the beginning of November. Currently, the USD/SGD currency pair is trading at the 1.3680 level.
Note that the exchange rate is supported by the 55-, 100– and 200-hour moving averages. Therefore, it is likely that some upside potential could continue to prevail in the market in the nearest future.
The currency pair could reach the descending trend line located in the 1.3700/1.3720 area. If the given line does not hold, the US Dollar could continue to appreciate against the Singapore Dollar in the medium term. Otherwise, a reversal south could follow. Important level to look out for is the psychological level at 1.3550.
Author

Dukascopy Bank Team
Dukascopy Bank SA
Dukascopy Bank stands as an innovative Swiss online banking institution, with its headquarters situated in Geneva, Switzerland.


