Patterns: USD/THB TRY/JPY
USD/THB 1H Chart: Descending triangle in sight
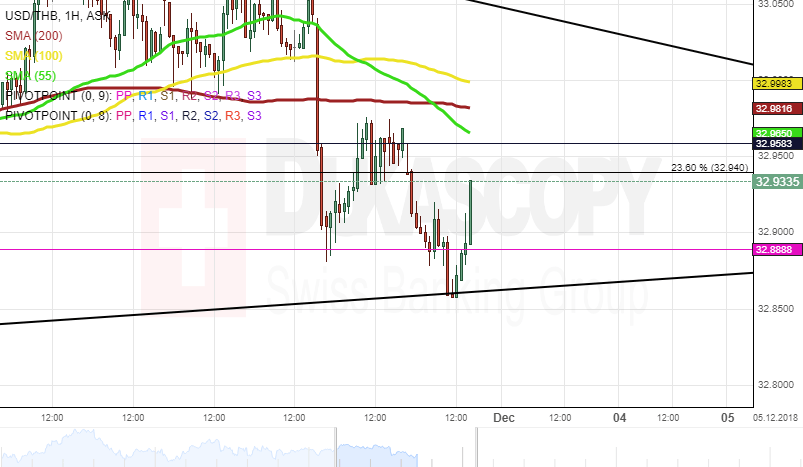
The USD/THB currency pair has been trading in a descending triangle since the end of October.
From a theoretical point of view, a breakout north from the pattern occurs in the nearest future. A potential upside target is the upper boundary of the medium-term descending channel located circa 3.20. Technical indicators for the 1W time frame support bullish scenario.
However, important resistance level to surpass is a combination of the 55-, 100– and 200-hour SMAs in the 33.00 area. If given level holds, it is likely that the pair goes downside to the Fibonacci 38.20% retracement at 32.59.
TRY/JPY 1H Chart: Medium-term channel in sight
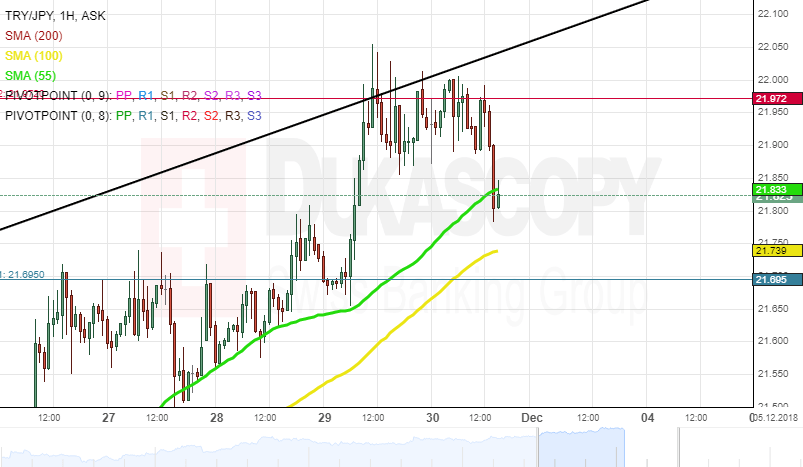
The Turkish Lira has been driven by a strong upside momentum against the Japanese Yen since the middle of August, and thus sending the currency pair to the weekly R2 at the 21.97 mark.
As apparent on the chart, the pair is testing the upper boundary of the medium-term ascending channel at 22.00. Given that the exchange rate is being supported by the 55– and 100-hour SMAs, it is expected that a breakout north occurs in the nearest future.
However, if given channel holds, it is likely that a reversal south occurs soon. Important support level to look out is the 200-hour SMA, currently located at 21.46.
Author

Dukascopy Bank Team
Dukascopy Bank SA
Dukascopy Bank stands as an innovative Swiss online banking institution, with its headquarters situated in Geneva, Switzerland.


