Patterns: USD/MXN, USD/THB
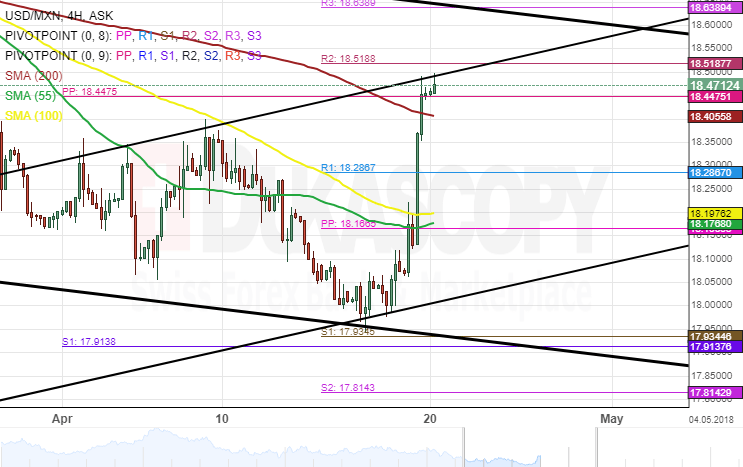
USD/MXN 4H Chart: Jumps to 18.50 mark
The US Dollar recently gained massively against the Mexican Peso. That occurred mainly due to the political turmoil around the Mexican Presidential election, which caused a sudden fall in the value of the Peso.
However, the surge was stopped by a resistance line of a speculated ascending channel pattern at the 18.50 mark. Although, the psychological significance of this level might also have played a role.
Due to that reason a descent should be expected. However, the pair is set to face the support of the 200-period SMA and the monthly PP, respectively, at 18.41 and 18.45.
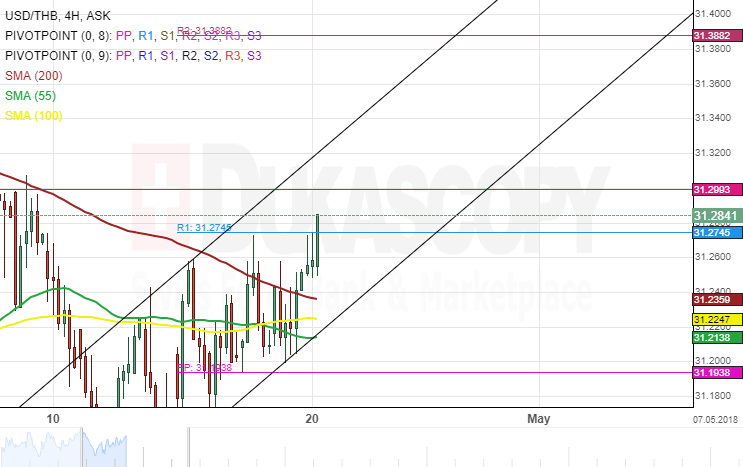
USD/THB 4H Chart: Breaks long term SMAs
There is something about the USD/THB pair that you can observe only by changing the time frames of the charts while having set up them to show the 200-period simple moving average.
Namely, the most important is the fact that the currency exchange rate has passed the 200-day SMA, which has kept the pair lower since the start of 2017. In addition, the four hour time frame 200-period simple moving average has recently been broken.
As a result of these moves in a combination with the passing of the weekly R1, the rate began a surge. The surge is set to be paused by a monthly pivot point at 31.30. However, above that there is almost nothing until 31.40.
Author

Dukascopy Bank Team
Dukascopy Bank SA
Dukascopy Bank stands as an innovative Swiss online banking institution, with its headquarters situated in Geneva, Switzerland.


