Patterns: USD/MXN, USD/ILS

USD/MXN 1H Chart: Downside potential could prevail
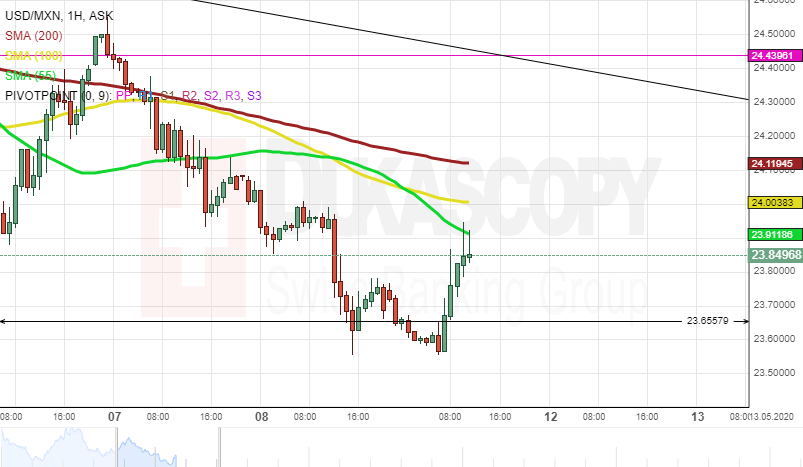
The USD/MXN currency pair has been trading within a descending triangle pattern since the end of April. The pair pierced the lower pattern line at 23.66 and resumed to trade within the given pattern.
Note that the exchange rate is pressured by the 55-, 100– and 200-hour moving averages in the 24.00 area. Thus, some downside potential could prevail in the market.
However, the expected decline might not be immediate, as the rate could gain support from the monthly S1, S2 and S3, located at 23.08, 21.96 and 20.60 respectively.
USD/ILS 1H Chart: Falling wedge pattern in sight
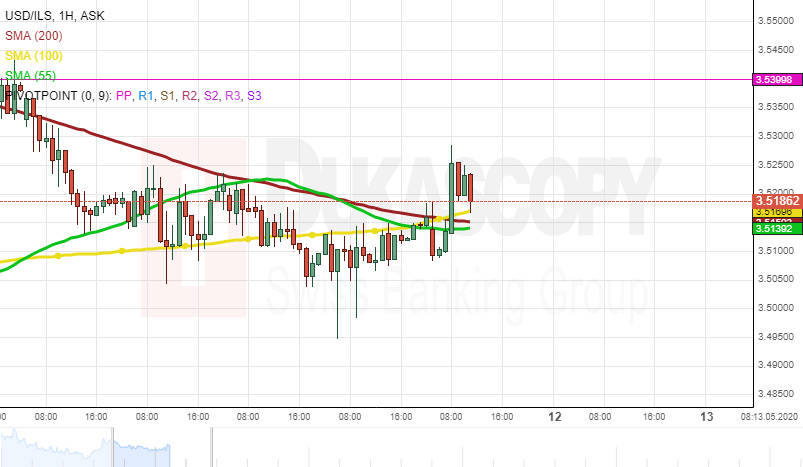
The USD/ILS exchange rate has been trading within a falling wedge pattern since the beginning of April. The rate has already declined below the 3.5500 level.
From a theoretical point of view, it is likely that the currency pair could continue to trade downwards within the given pattern in the medium term. In this case the rate could reach the monthly S1 by the end of May.
However, note that the exchange rate is supported by the 55-, 100– and 200-hour moving averages near 3.5000. Thus, some upside potential could prevail in the market, and the rate could breach the given pattern north. In this case the rate could face the resistance provided by the monthly R1 at 3.6114.
Author

Dukascopy Bank Team
Dukascopy Bank SA
Dukascopy Bank stands as an innovative Swiss online banking institution, with its headquarters situated in Geneva, Switzerland.


