Patterns: USD/MXN, EUR/PLN

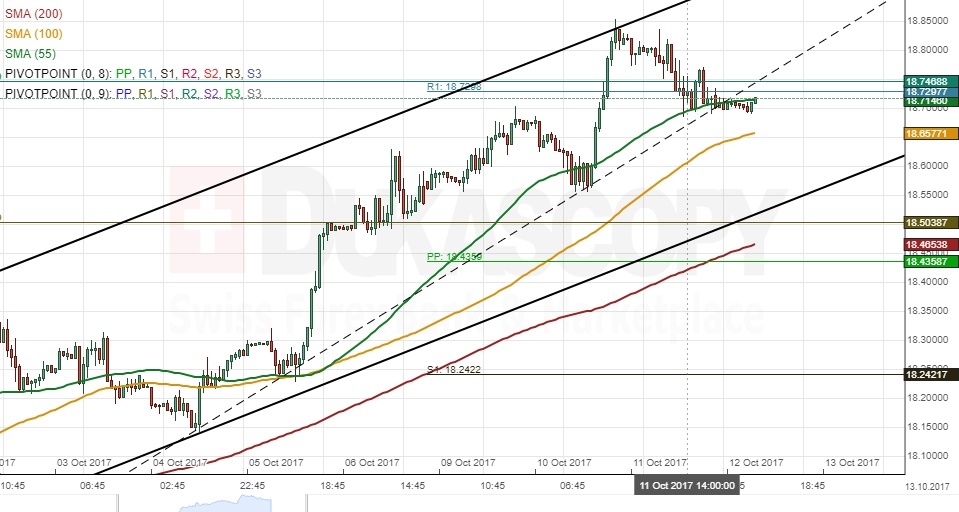
USD/MXN 1H Chart: Channel Up
The US Dollar has appreciated substantially against the Mexican Peso during the past three weeks. The pair managed to reach a five-month high at 18.84 on Tuesday evening. Subsequently, the Greenback edged lower and breached the diminishing trading range apparent since early October. The given currency managed to move below a strong support cluster formed by the monthly R2, weekly R1 and the 55-hour SMA. These factors suggest a possible downside momentum that could push the rate towards the lower channel boundary circa 18.60/65. A breakout of this line should be followed by a fall down to the weekly PP and the 200-hour SMA near 18.40.
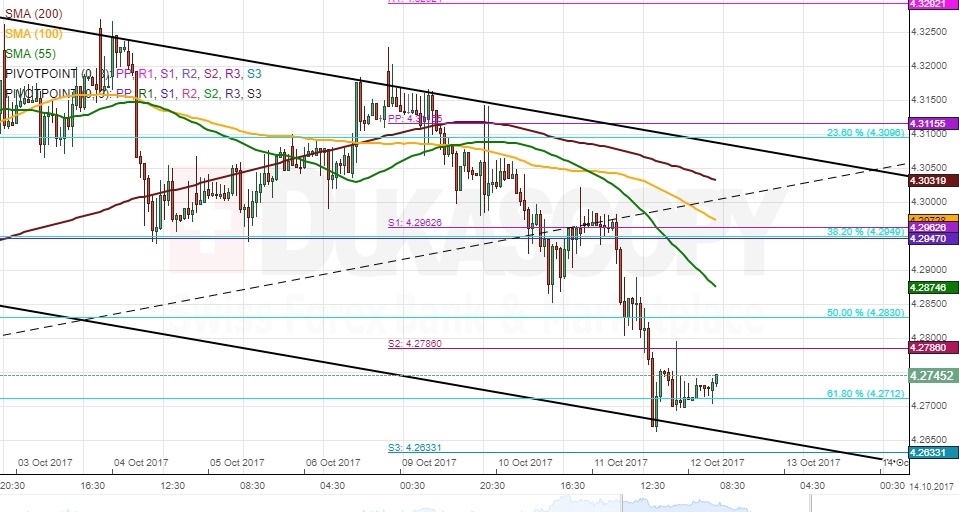
EUR/PLN 1H Chart: Channel Down
EUR/PLN had been trading in an ascending channel since late August prior to breaching this pattern to the downside on Tuesday. The pair's movement during the past two weeks resembles a channel down; however, another bottom confirmation is still needed. Meanwhile, the common European currency has been testing the lower channel line for several hours, thus not being able to move below the 61.8% Fibonacci retracement. Technical indicators suggest that the rate should recover in the short term. A possible upside target could be the upper channel boundary circa 4.2950—a level which is reinforced by the 55– and 100-hour SMAs, the monthly PP and the weekly S1. In case of a downside momentum, the pair should be limited by the monthly S1 at 4.2560.
Author

Dukascopy Bank Team
Dukascopy Bank SA
Dukascopy Bank stands as an innovative Swiss online banking institution, with its headquarters situated in Geneva, Switzerland.


