Patterns: NZD/CHF, USD/SGD

NZD/CHF 1H Chart: Kiwi tests trend-line
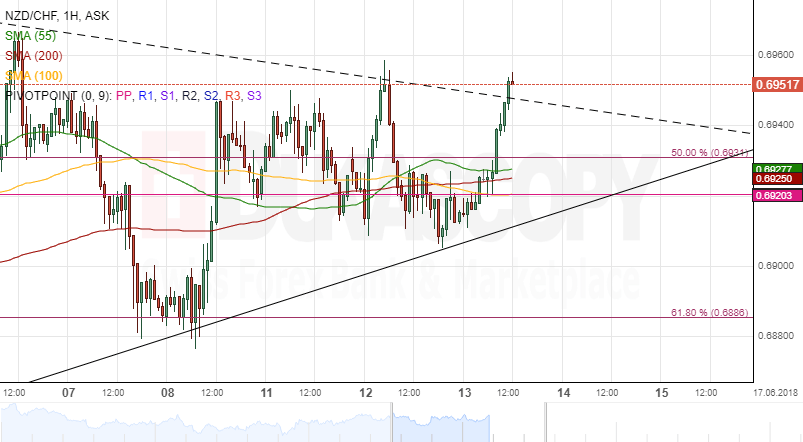
The New Zealand Dollar has gained momentum against the Swiss Franc since May 29. At the time, the Kiwi reversed from the bottom boundary of a medium-term wedge near 0.6825.
The pair has been trading sideways along a downward-sloping trend-line which was formed early in April. It seems that the given line might be breached today. This should result in a continuous surge until the upper channel boundary is reached circa 0.7050. The upper wedge line, the 23.60% Fibonacci retracement and the monthly R1 are likewise located there.
Technical indicators flash mixed signals, so the bearish scenario should likewise be considered. In case the pair breaches all three SMAs on both the 1H and 4H time-frames near 0.69, it is likely that the Kiwi returns to the lower wedge boundary or the monthly S1 at 0.6850 and 0.6795, respectively.
USD/SGD 4H Chart: Rate tests strong resistance
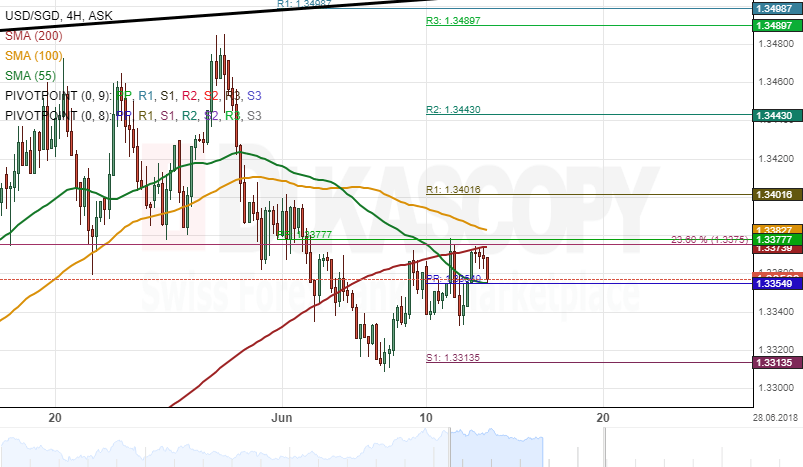
The US Dollar has been trading in an ascending channel against the Singapore Dollar. This pattern began early in January and has since guided the pair towards a new 2018 high of 1.3480. The pair also breached the previous long-term pattern at the beginning of May.
During the past three weeks, the US Dollar has been moving sideways, fluctuating between the aforementioned yearly high and the 1.33 level. The pair is still located in the given range. It has, however, fallen below the 100– and 200-period SMAs which is a bearish signal. Technical indicators on the daily chart are likewise tended southwards.
Taking this into account, it is expected that the Greenback weakens during the following weeks, setting the monthly S1 at 1.3265 as a possible weekly target.
Author

Dukascopy Bank Team
Dukascopy Bank SA
Dukascopy Bank stands as an innovative Swiss online banking institution, with its headquarters situated in Geneva, Switzerland.


