Patterns: NZD/CAD , SGD/JPY

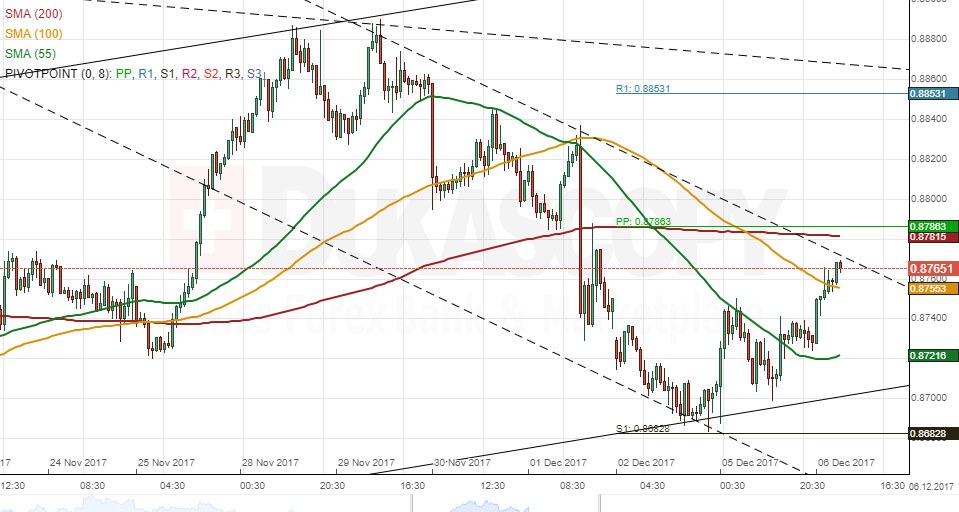
NZD/CAD 1H Chart: Channel up prevails
A descending channel has confined NZD/CAD since late August. The latest test of its bottom boundary occurred on November 17 when the New Zealand Dollar reversed to the upside and formed a channel up. In line with this pattern, the pair should still appreciate up to the 0.89 area where the upper boundaries of this pattern and the senior one are located. However, the Kiwi faces a significant resistance cluster set by the weekly and monthly PPs and the 200-hour SMA in the 0.8780/0.8800 territory. As suggested by technical indicators, this might mark a point of reversal. In this case, the Kiwi is likely to breach the channel up and continue trading in a newly-formed one-day channel down towards the bottom boundary of the senior pattern. The nearest support of significance is the 55-hour SMA at 0.8723; the weekly and monthly S1s are likewise located nearby circa 0.8670.
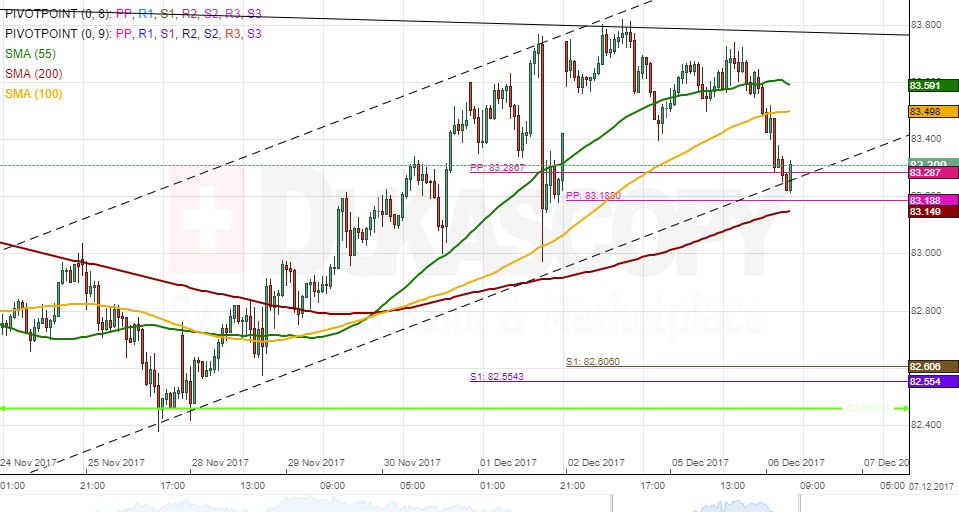
SGD/JPY 1H Chart: Rate tests short-term channel
A pattern that has dominated the SGD/JPY currency pair since late April is an ascending wedge. It seems that the maturity of this pattern could be reached within the following weeks, thus pointing to a possible breakout south. In the short term, the Singapore Dollar bounced off the upper wedge boundary early in November and has since edged lower; thus, another formation—a more chaotic channel down—is apparent on the chart. This pattern is guiding the pair towards the lower wedge boundary in the 82.60/83.00 area. The given channel is expected to dominate, thus pointing to weakening during the following week. The nearest support is the 200-hour SMA, the weekly and monthly PPs circa 83.20. The Singapore Dollar might hinder near this mark, but should eventually breach it and approach the weekly and monthly S1s at 82.60.
Author

Dukascopy Bank Team
Dukascopy Bank SA
Dukascopy Bank stands as an innovative Swiss online banking institution, with its headquarters situated in Geneva, Switzerland.


