Patterns: GBP/AUD, GBP/CAD, USD/ILS, USD/MXN

GBP/AUD 4H Chart: Breakout could occur
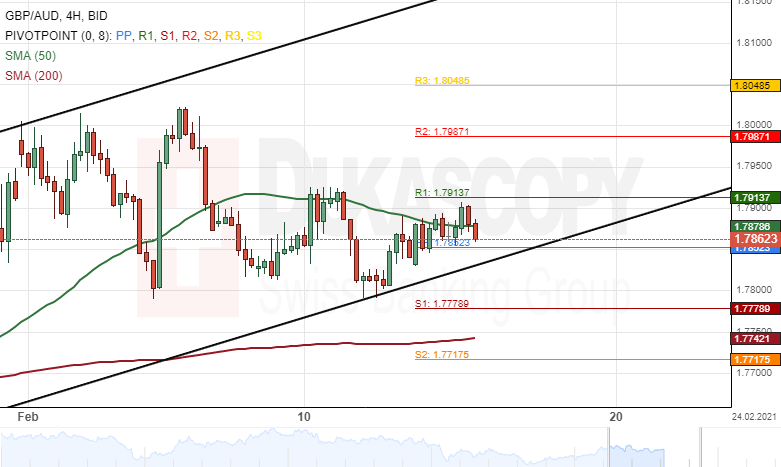
The British Pound has declined by 1.18% against the Australian Dollar since February 2. The GBP/AUD currency pair tested the lower boundary of an ascending channel pattern at 1.7810 on February 12.
Currently, the exchange rate is trading near the lower line of the channel pattern and could be set for a breakout.
If the breakout occurs, a decline towards the 1.7600 level could be expected during the following trading sessions.
However, if the ascending channel holds, bullish traders would pressure the currency exchange rate higher within this week's trading sessions.
GBP/CAD 4H Chart: Could edge higher
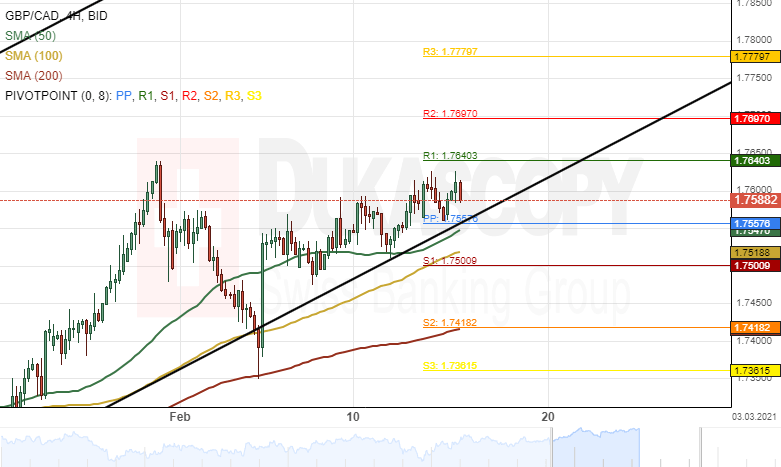
The Pound Sterling has surged by 1.31% against the Canadian Dollar since February 4. The GBP/CAD currency pair breached the 1.7600 level during this week's trading sessions.
All things being equal, the exchange rate could continue to edge higher in an ascending channel pattern during the following trading sessions. The potential target for bullish traders would be near the 1.7800 level.
However, a support cluster near the 1.7540 area could provide support for the currency exchange rate in the shorter term.
USD/ILS 4H Chart: Two scenarios likely
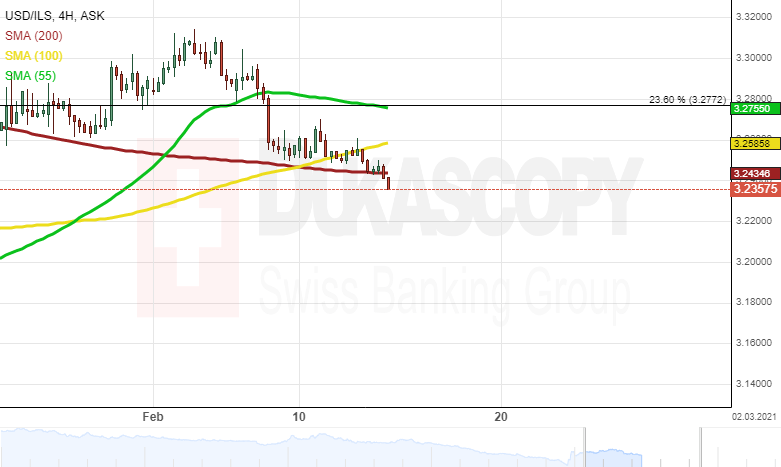
At the middle of January, the USD/ILS exchange rate reversed north from the psychological level at 3.1200.
From the one hand, it is likely that the currency pair could gain support from the 200-period moving average near 3.2400. Thus, some upside potential could prevail in the market, and the pair could target the Fibo 50.00% at 3.4530.
From the other hand, it is likely that the exchange rate could be pushed down by the 55-period moving average near 3.2800. Thus, some downside potential could prevail in the market.
USD/MXN 4H Chart: Downside potential could prevail
Since the middle of September, the USD/MXN currency pair has been trading within a falling wedge pattern.
From a theoretical point of view, it is likely that the exchange rate could continue to decline within the predetermined pattern in the medium term. The rate could decline below 19.50 by the middle of March.
In the meantime, it is unlikely that bulls could prevail in the market, and the currency pair could exceed the Fibonacci 61.80% retracement at 20.87.

Author

Dukascopy Bank Team
Dukascopy Bank SA
Dukascopy Bank stands as an innovative Swiss online banking institution, with its headquarters situated in Geneva, Switzerland.


