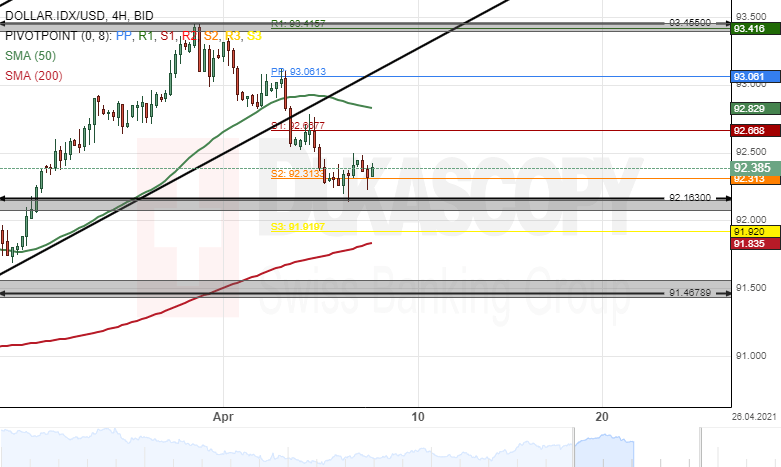
DOLLAR.IDX/USD 4H chart: Breakout occurs
The dollar index, which measures the US Dollar against a basket of major currencies, has declined by 1.20% since April 1. A breakout occurred through the lower boundary of an ascending channel pattern during this week's trading sessions.
Given that a breakout has occurred, the DXY index is likely to continue to edge lower during the following trading sessions. The potential target for sellers will be near the 91.50 area.
However, the DOLLAR.IDX/USD pair could bounce off from a support line at 92.16 within this week's trading sessions.
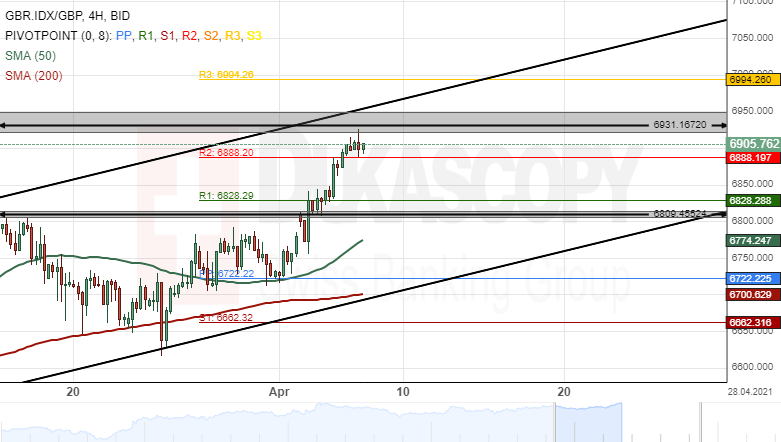
GBR.IDX/GBP 4H chart: Tests 3-month high
The UK100 index, which compiles the top 100 capitalized UK companies listed on the London Stock Exchange, has surged by 4.05% since March 25. The GBR.IDX/GBP pair breached a three-month resistance level at 6808.4 during this week's trading sessions.
Technical indicators suggest buying signals on the 4H, daily and weekly time-frame charts. Most likely, buyers could continue to pressure the price higher during the following trading sessions.
However, bullish traders could encounter resistance near the 6950.00 level this week.
This overview can be used only for informational purposes. Dukascopy SA is not responsible for any losses arising from any investment based on any recommendation, forecast or other information herein contained.
Recommended Content
Editors’ Picks
AUD/USD failed just ahead of the 200-day SMA
Finally, AUD/USD managed to break above the 0.6500 barrier on Wednesday, extending the weekly recovery, although its advance faltered just ahead of the 0.6530 region, where the key 200-day SMA sits.
EUR/USD met some decent resistance above 1.0700
EUR/USD remained unable to gather extra upside traction and surpass the 1.0700 hurdle in a convincing fashion on Wednesday, instead giving away part of the weekly gains against the backdrop of a decent bounce in the Dollar.
Gold keeps consolidating ahead of US first-tier figures
Gold finds it difficult to stage a rebound midweek following Monday's sharp decline but manages to hold above $2,300. The benchmark 10-year US Treasury bond yield stays in the green above 4.6% after US data, not allowing the pair to turn north.
Bitcoin price could be primed for correction as bearish activity grows near $66K area
Bitcoin (BTC) price managed to maintain a northbound trajectory after the April 20 halving, despite bold assertions by analysts that the event would be a “sell the news” situation. However, after four days of strength, the tables could be turning as a dark cloud now hovers above BTC price.
Bank of Japan's predicament: The BOJ is trapped
In this special edition of TradeGATEHub Live Trading, we're joined by guest speaker Tavi @TaviCosta, who shares his insights on the Bank of Japan's current predicament, stating, 'The BOJ is Trapped.'