Patterns: Dollar,IDX/USD, GBR,IDX/GBP

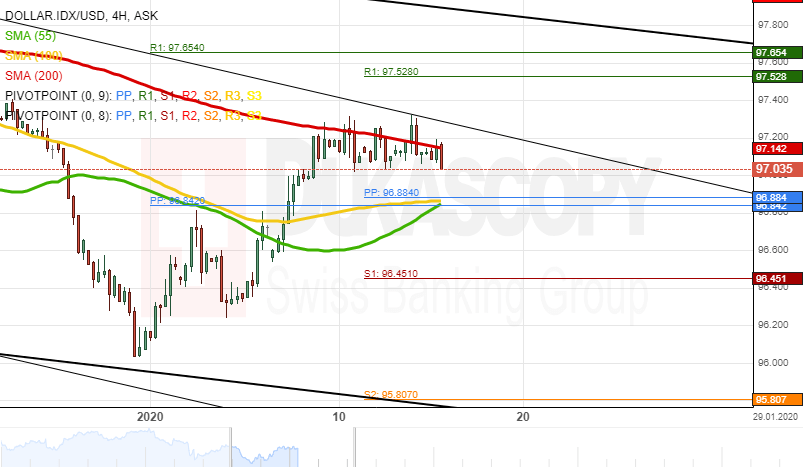
Dollar.IDX/USD 4H Chart: Hits six-week low
The dollar index, which measures the US Dollar against a basket of major currencies, has been edging lower in a descending channel pattern since the end of November. The currency pair hit a six-month low at 96.04 during last week's trading sessions.
Currently, the Dollar.IDX/USD pair is testing a resistance level formed by the 200– hour simple moving average at 97.18.
From a theoretical point of view, the pair will make a brief downside movement within this week's trading sessions. The potential target will be at the 96.60 area.
However, given that the pair is trading near the upper line of the descending channel pattern, a breakout might occur in the nearest future.
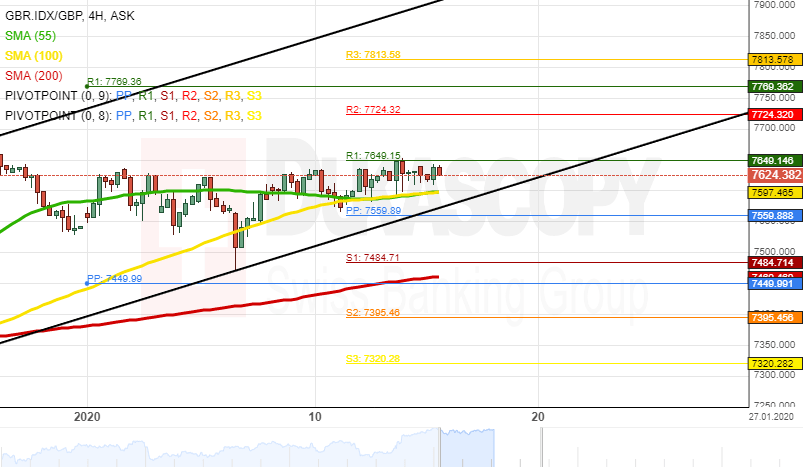
GBR.IDX/GBP 4H Chart: Buy signals
The UK100, which measures the best 100 performing stocks from the London Stock Exchange, has surged by 6.79% in value since the beginning of December. The pair tested the upper boundary of an ascending channel pattern at 7676.88 on December 27.
Everything being equal, the GBR.IDX/GBP pair will most likely continue to trade north in the ascending channel pattern during the following trading sessions. The potential target will be at the 7800.00 marks.
However, given that the pair the UK100 index is trading near the bottom border of the ascending channel pattern, a breakout could occur within this week's trading sessions.
Author

Dukascopy Bank Team
Dukascopy Bank SA
Dukascopy Bank stands as an innovative Swiss online banking institution, with its headquarters situated in Geneva, Switzerland.


