Patterns: CHF/JPY, CAD/CHF, TRY/JPY, ZAR/JPY

CHF/JPY 4H Chart: Trading within range
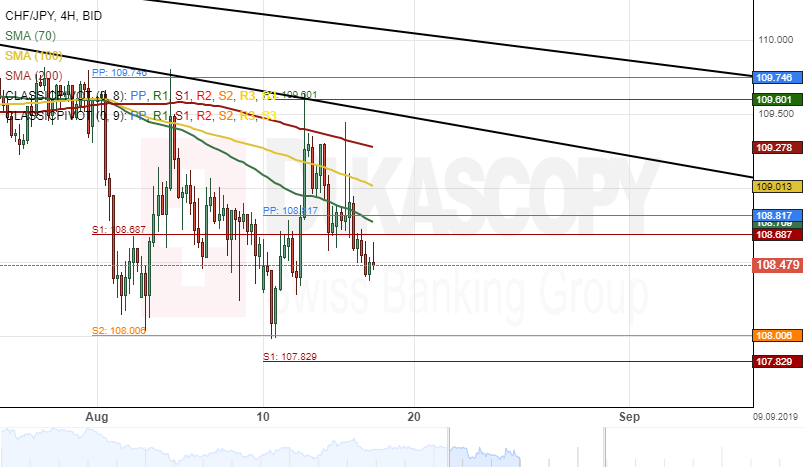
The CHF/JPY exchange rate has been trading between the 109.74/108.00 range since the beginning of August. The Swiss Franc depreciated about 1.53% in value against the Yen during last week's trading sessions.
As apparent on the 4(H) chart, the currency pair has already reversed south from a resistance level set by the monthly pivot point at 109.74. From a theoretical point of view, the rate should continue moving south until it reaches the support level formed by the monthly S2 at 108.00.
Moreover, technical indicators demonstrate that the currency exchange rate will continue its decline in the shorter term.
CAD/CHF 4H Chart: Could go down
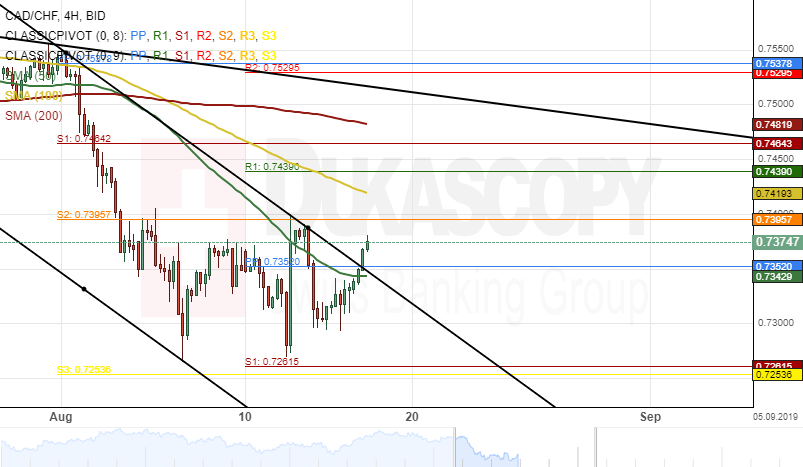
The CAD/CHF currency pair has been trading down since the beginning of July after the pair failed to surpass the resistance level located near the 0.7606 marks.
Currently, the exchange rate is trading near the upper boundary of a descending channel pattern at 0.7352 and could be set for a breakout.
Given that the Loonie is pressured by the 50– hour simple moving average, it is likely that the pair will continue its downward swing next week.
However, if the currency exchange rate passes the 50– hour SMA and the upper line of the channel pattern, bulls are likely to prevail in the market during the following trading sessions.
TRY/JPY 1H Chart: Two scenarios likely
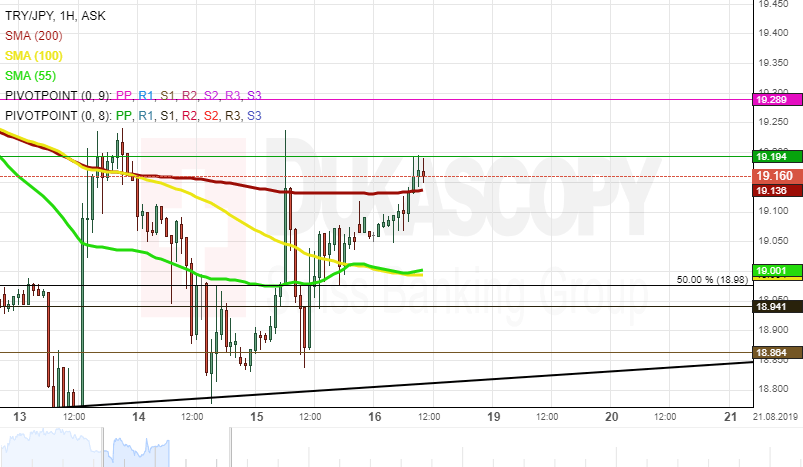
The Turkish Lira has been appreciating against the Japanese Yen within the ascending channel since the beginning of May. As apparent on the chart, the TRY/JPY currency pair is testing its lower boundary at 18.80.
From a theoretical perspective, short-term advance is expected, as the exchange rate could reverse south to target the upper channel line located in the 19.90/20.00 range. If the given trend holds, a general direction is expected to remain north.
However, note, that the rate is pressured by the 55-, 100– and 200-hour SMAs, currently located in the 18.99/18.13 range. Thus, the pair could breach the given channel south and go downwards to the Fibonacci 61.80% retracement at 18.25.
ZAR/JPY 1H Chart: Long-term channel in sight
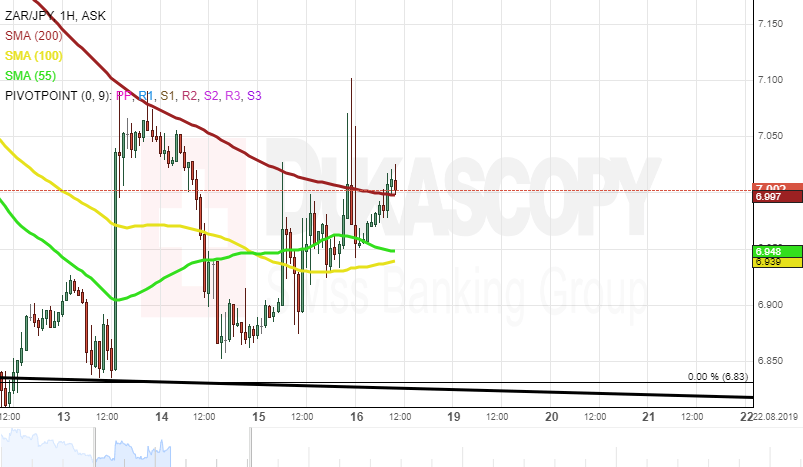
The ZAR/JPY currency pair has been trading downwards since the end of July after it reversed south from the upper boundary of the long-term descending channel at 7.81.
Currently, the exchange rate is testing the lower channel line at 6.85. From a theoretical point of view, it is expected, that a reversal north could occur in the nearest future, and the rate could reach the upper channel line in the medium term.
However, note, that the pair is pressured by the 55-, 100– and 200-hour SMAs, currently located in the 6.93/7.01 range. Thus, if the given channel does not hold, some downside potential could prevail in the market. A possible downside target is the psychological level at 6.50.
Author

Dukascopy Bank Team
Dukascopy Bank SA
Dukascopy Bank stands as an innovative Swiss online banking institution, with its headquarters situated in Geneva, Switzerland.


