Patterns: CAD/CHF CHF/JPY HKD/JPY EUR/HKD
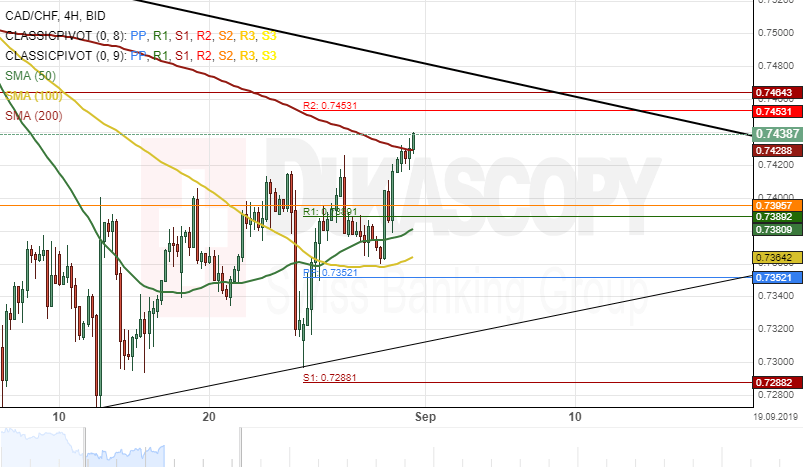
CAD/CHF 4H Chart: Testing 200-hour SMA
The Canadian Dollar has appreciated by 2.08% in value against the Swiss Franc since August 14.
The currency pair is currently testing a resistance level formed by the 200- hour simple moving average at 0.7429.
If the resistance level holds, the exchange rate might edge lower during the following trading sessions.
On the other hand, if the CAD/CHF currency exchange rate passes the 200-period SMAs, bullish traders might aim at the monthly pivot point at 0.7537 during next week's trading sessions.
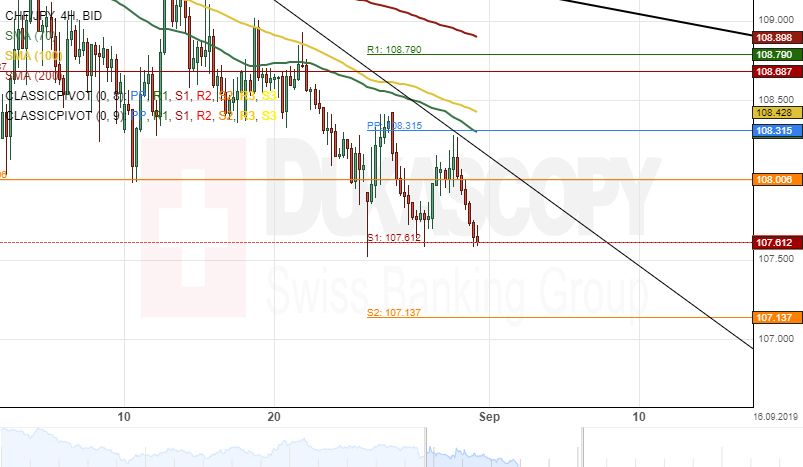
CHF/JPY 4H Chart: Reaches three-month low
The Swiss Franc has edged lower by about 1.73% in value against the Japanese Yen since August 14. The currency pair was trading near May 2019 low level at 107.71 during the morning hours of Friday's trading session.
Everything being equal, the CHF/JPY exchange rate will likely continue to fall during next week's trading sessions. Bearish traders could target a psychological support level at 106.50 next week.
Furthermore, technical indicators suggest bearish signals on the daily time-frame chart.
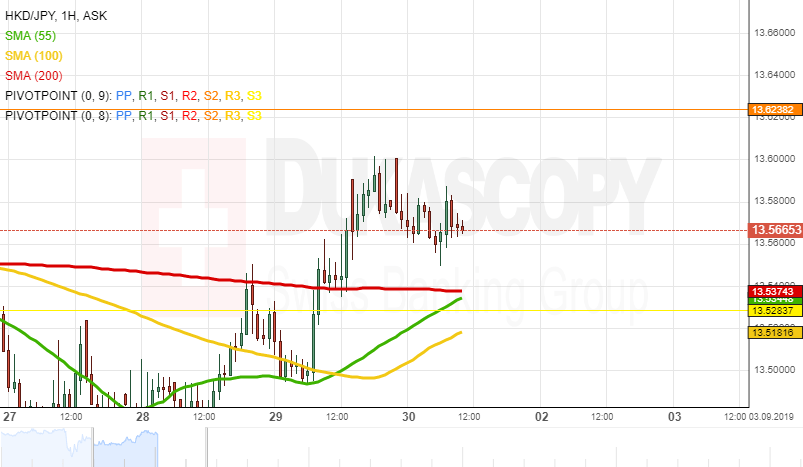
HKD/JPY 1H Chart: Falling wedge pattern in sight
On August 1, the HKD/JPY currency pair reversed south from the upper boundary of the falling wedge pattern at 13.96. The rate has been testing the lower wedge line at 13.40 since the middle of August.
From a theoretical point of view, it is likely that the exchange rate could trade upwards, as it should target the upper pattern line. However, note, that the rate has to surpass the resistance level formed by the monthly S2 at the 13.62 mark.
If the given resistance level holds, it is likely that the pair could reverse south to re-test the lower pattern boundary. Also, note that the Hong Kong Dollar is pressured by the 55-, 100– and 200-period SMAs (4H time-frame chart), located in the 13.53/13.67 range. Thus, if the given wedge does not hold, it is likely that the rate could continue to decline. A possible downside target is the psychological level at 13.00.
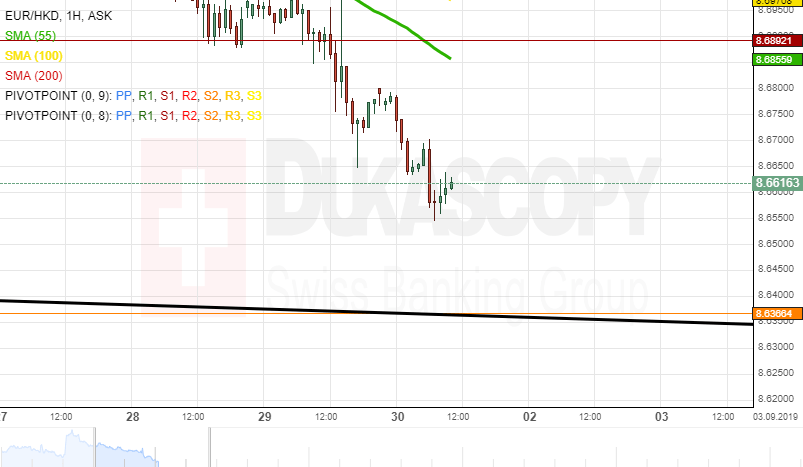
EUR/HKD 1H Chart: Short-term decline expected
The Euro has been depreciating against the Hong Kong Dollar since the beginning of August when the EUR/HKD currency pair reversed south from the resistance level—the monthly R1 at 8.8219. Currently, the pair is testin the support level—the weekly S1 at 8.6892.
Note that the exchange rate is pressured by the 55-, 100– and 200-hour moving averages, it is likely that some downside potential could prevail in the market. The rate could reach the lower boundary of the long-term descending channel in the 8.6000/8.6500 range.
If the given channel hold, it is likely that a reversal north could follow. Otherwise, it is expected that the pair could reach the monthly S2 at the 8.5114 mark.
Author

Dukascopy Bank Team
Dukascopy Bank SA
Dukascopy Bank stands as an innovative Swiss online banking institution, with its headquarters situated in Geneva, Switzerland.


