Patterns: BTC/USD, ETH/USD

BTC/USD 4H Chart: Triangle pattern
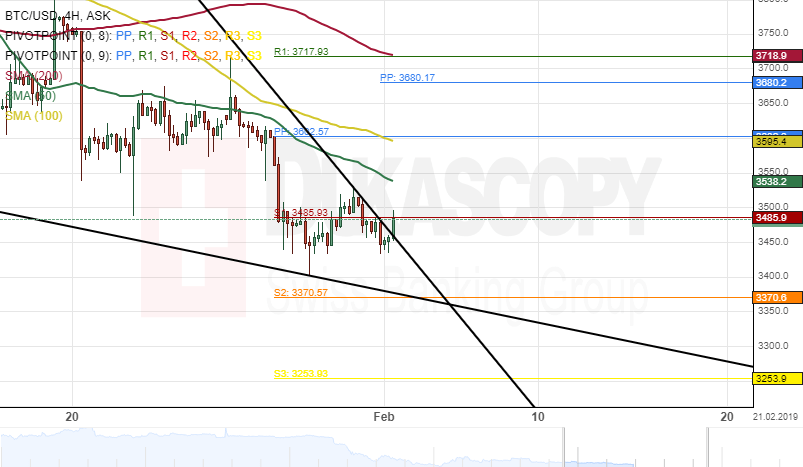
The BTC/USD pair is currently trading in a descending triangle pattern. The pair tested the upper boundary of the triangle-like formation pattern at 3500.0 during yesterday's trading session.
Given that the bitcoin cryptocurrency is trading in a descending triangle pattern, and the three SMAs is above the price level, it is likely that the pair will continue moving south until it reaches a support level at the 3300.9 area.
However, a support cluster formed by the lower boundary of the triangle pattern and the monthly S2 at 3370.5 could provide support for the pair within the coming sessions.
ETH/USD 4H Chart: Decline continues
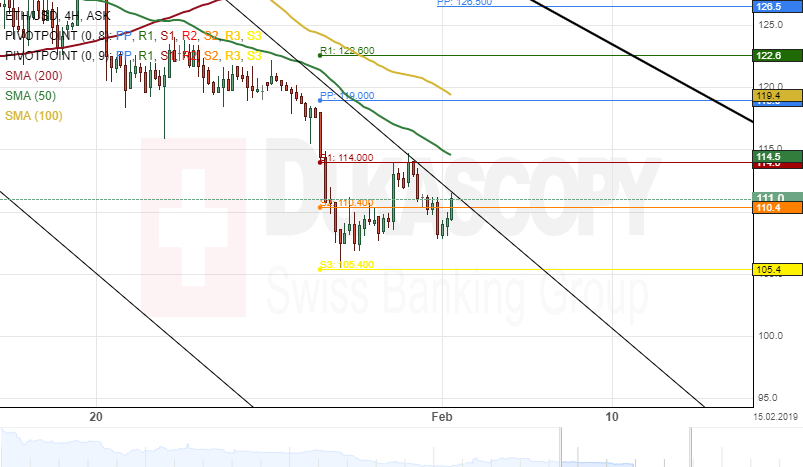
The Ethereum cryptocurrency has continued to depreciate against the US Dollar. The 50–hour simple moving average has guided the pair toward the 105.40 area a few days ago.
As for the near future, it is likely that the ETH/USD exchange rate continues to fall during the following trading sessions. The potential downside targets will be near the weekly S1 at 89.60.
Although, the monthly support level at 105.40 could hinder bears from pushing the cryptocurrency lower today.
Author

Dukascopy Bank Team
Dukascopy Bank SA
Dukascopy Bank stands as an innovative Swiss online banking institution, with its headquarters situated in Geneva, Switzerland.


