Patterns: AUD/CHF, USD/CNH

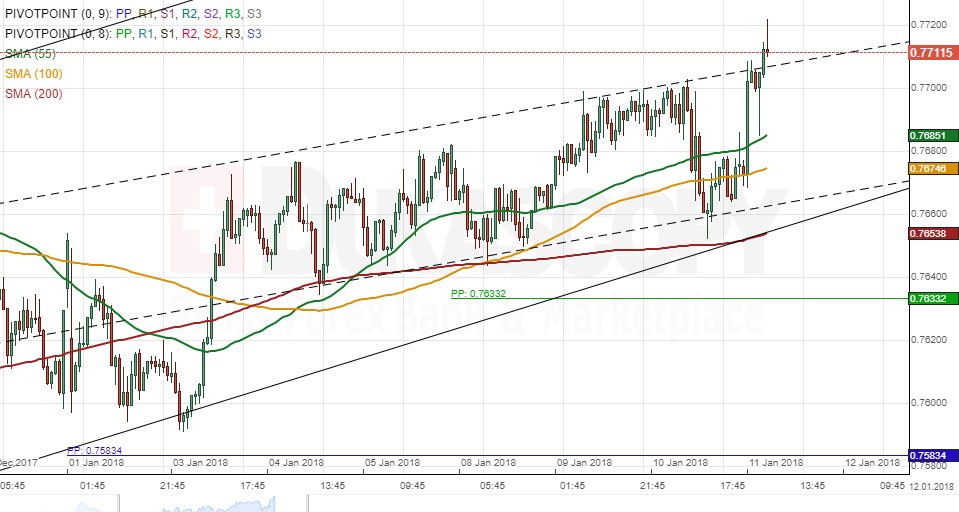
AUD/CHF 1H Chart: Pair likely to test senior 0.7750
The Australian Dollar has appreciated substantially against the Swiss Franc since late November. This upward movement has been constrained in a channel up. During the past week, the Aussie has failed to reach its upper boundary, thus pointing to a possible breakout south. A subsequent surge, however, might occur only within the following two weeks, given that the upper boundary of a senior channel circa near 0.7750 has not yet been reached. Technical indicators suggest that the Aussie is likely to realise this upward potential during the following trading sessions. Some weakness might be apparent today; however, the combined support of the 55– and 100-hour SMAs located near the 0.7680 mark is expected to stop any further down-fall. The nearest notable resistance is the monthly R1 and the weekly R2 at 0.7740.
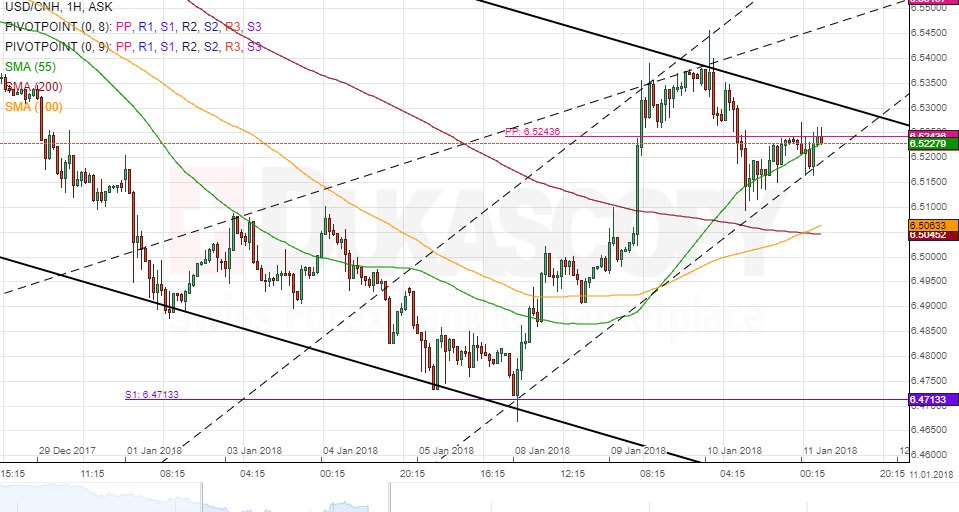
USD/CNH 1H Chart: Pair remains near channel
The US Dollar’s movement against the Chinese Yuan during the past six weeks has been guided by a descending channel. The pair was trading along its bottom line last week and thus fell to its four-month low of 6.47; however, it did eventually gain strength on Monday. Following a test of the 6.54 mark, the Greenback initiated a new wave down—a move was disrupted by the 55-hour SMA. Given that the pair remains testing this line for several hours, it might be finally breached within this session. A subsequent fall, however, should be stopped by the 100– and 200-hour SMAs near 6.5050. The steepness of the senior channel suggests that it could be breached during the next week. A surge might follow, thus setting the 6.55 area as a near-term target and 6.59—for a longer term.
Author

Dukascopy Bank Team
Dukascopy Bank SA
Dukascopy Bank stands as an innovative Swiss online banking institution, with its headquarters situated in Geneva, Switzerland.


