Panic selling continues to hit markets, but is the USD fall set to continue? [Video]
![Panic selling continues to hit markets, but is the USD fall set to continue? [Video]](https://editorial.fxstreet.com/images/Markets/Currencies/Majors/DollarIndex/billete-de-un-dolar-gm510323320-86203025_XtraLarge.jpg)
Market Overview
The sell-off of risk assets is ramping up. With Wall Street over -4% lower last night, the Dow saw its largest points decline since 2008. The futures for today’s session, show that the selling pressure has not abated quite yet either. Fear continues to spread through markets. The VIX Index of S&P 500 options volatility has spiked to its highest level since January 2018. The flood gates have also opened on US Treasury yields, which is seeing the US 10 year yield plunging to all-time lows. The safety of US debt is the place to be right now. One interesting casualty right now has been the US dollar. It has been a strong haven of safety in recent weeks, but as cases of Coronavirus pop up in the US now, the fear is that the negative economic impact is knocking at Uncle Sam’s door. Last week, it was the yen that took the hit from fears over a Japanese economy, this week it is the dollar’s turn to be sold. There has been a massive shift in expectation of a Fed rate cut which has dragged on the dollar. However, we see this as a near term knee jerk move that is unlikely to last. Although the US 10 year yield has fallen -40 basis points in the past two weeks, with such elevated volatility, moves on rate differentials are quickly being priced in. The question is how far markets go before the elastic snaps back? We are seeing extreme technical positions forming on Wall Street now (elevated volume indicates panic selling). Could we be close to a near term technical rally? For now, the selling pressure continues.
Wall Street closed a huge session of losses with the SP 500 -4.4% lower at 2978. With US Futures another -0.6% lower today, there is a spread of selling across global markets again this morning. Asian markets were broadly slammed with Nikkei -3.6% and Shanghai Composite -3.7%. In Europe, the sell-off also extends with FTSE futures -3.0% and DAX futures -3.3% (even if these levels are off earlier lows). In forex, there is a continuation of JPY outperformance and sizable risk-off positioning with AUD and NZD significant underperformance. It is interesting to see USD beginning to stabilise against EUR and pulling Cable lower. In commodities, there is a big decline forming through gold (-1.0%) as volatility continues, and oil is another -2.5% lower.
It is a day of inflation on the economic calendar. German Prelim HICP for February is throughout the morning, with the countrywide data at 1300GMT which is expected to remain at +1.6% (+1.6% in January). Then the Fed’s preferred inflation gauge, the core Personal Consumption Expenditure for January is at 1330GMT which is expected to grow by +0.2% on the month which would increase the year on year reading to +1.7% (from +1.6% in December).
There are no Fed speakers today, but a couple of Bank of England MPC members that will be worth looking out for today, as Andy Haldane (at 1115GMT) and Jon Cunliffe at 1615GMT.
Chart of the Day – German DAX
With the DAX falling off a cliff (along with all other equity markets) in the past six sessions, it is an important time to see where the analysis sits. Dropping over -10% lower from the all-time high of 13,795 sees the DAX in official correction territory. Key support levels have been broken on the way but it is a move that is still just a retreat within a well-defined long term uptrend channel which comes in as a basis of support at 12,140 today. The RSI is well into oversold territory into the low 20s, but there is little reason to expect a sustainable rebound right now. Volatility on the DAX is understandably elevated right now, with the Average True Range of 228 ticks at six month highs, whilst the market closed well below the 2.0 SD Bollinger Bands yesterday. However, the market is getting smashed again early today and the channel is breaking now. The focus will be on the September low of 11,880 which marks a significant long term pivot level and is key support now. A breach would bring the August 2019 low of 11,265 into play, and this is a crucial support. The bulls need just to stem the tide of selling, even small losses would be a bonus right now.
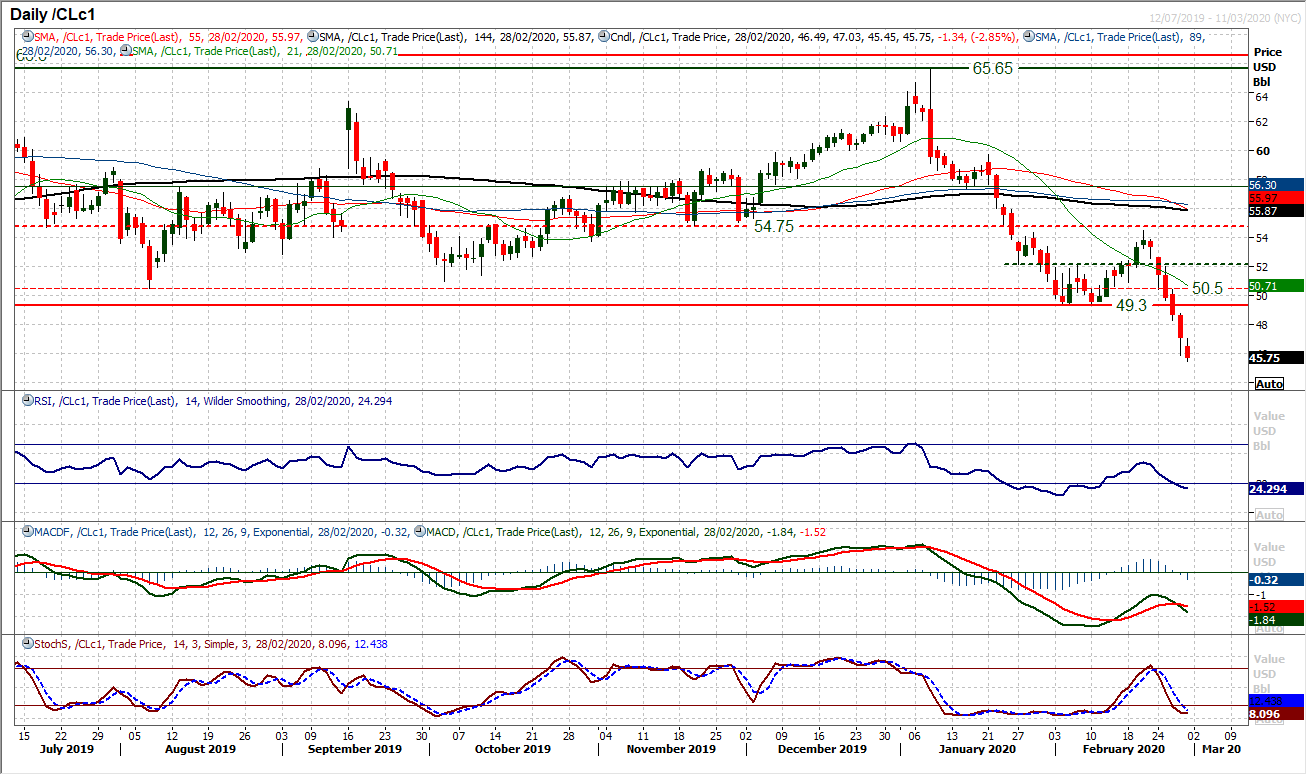
WTI Oil
The oil price continues to be smashed. Day after day the selling pressure is hitting the market and having traded decisively clear below $49.30 the market is now eyeing the crucial December 2018 low of $42.35. Momentum indicators are bearish but also show further downside potential still. Once more this morning, the selling pressure is hitting the market. Intraday rallies are being seen though, but these are just unwinding moves before the next wave of selling. The hourly RSI around 40/50 is a zone of opportunity for the bears now. Initial resistance at $45.90/$47.00. It needs a rebound above $47.75 for the bulls to even contemplate the potential for a rally of substance.
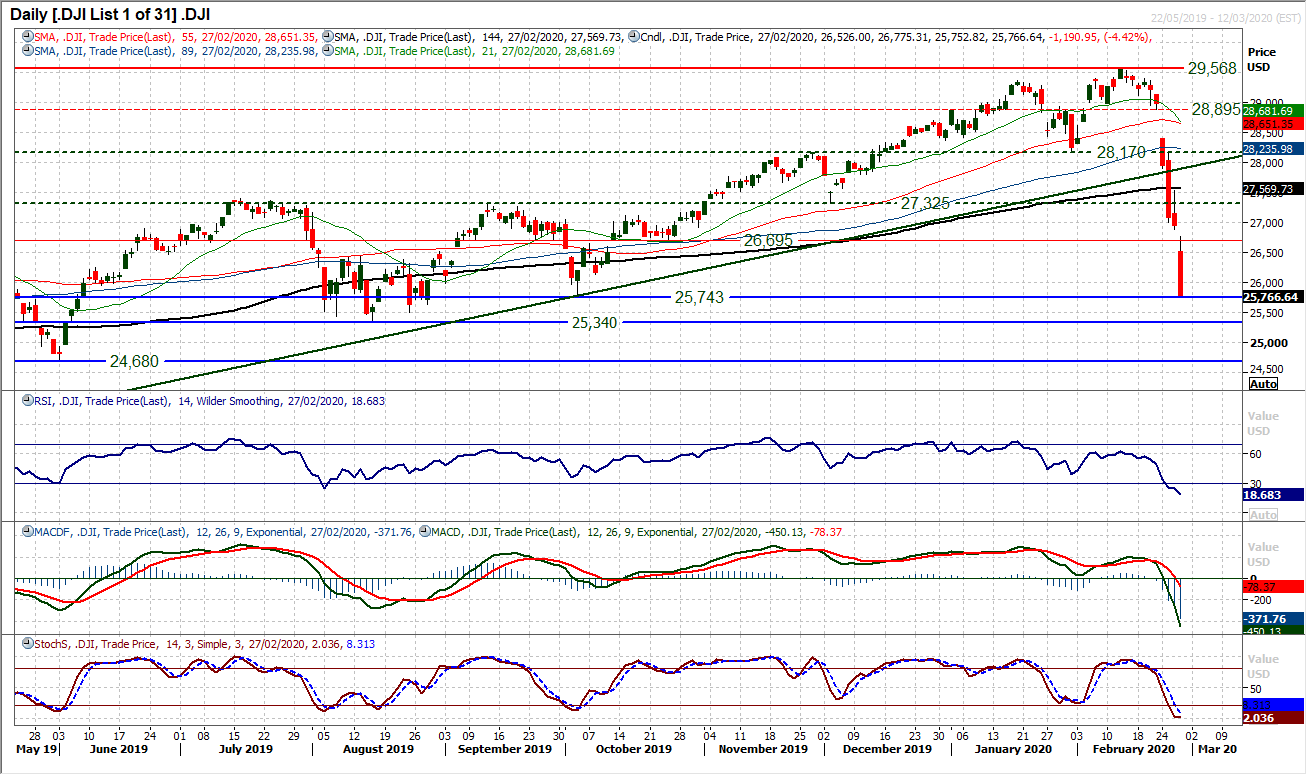
Dow Jones Industrial Average
Falling another 1190 ticks yesterday, the Dow had its biggest one day decline since October 2008, where markets were in the teeth of the great financial crisis. Volatility is huge, with traders and investors selling what they can right now. The market has fallen through several major support levels in the past week and closed last night around the key October low of 25,743. The problem is that futures are pointing to another 1% to 2% decline at the open today, meaning that the key August low of 25,340 will be directly challenged early today. However, seeing as some major support levels have mattered little this week, the momentum of the selling pressure is just smashing through anything in its path. The RSI is around 18 today, with MACD and Stochastics very bearishly configured. This is very much reaching extreme territory though now. The Dow is trading way below its 2.0 SD Bollinger Bands, whilst volume in yesterday’s sell-off was at a 14 month high. It is difficult to know where the sell-off might end, but around the open today (if futures are anything to go by) the decline will be in the region of -14% in the two weeks since the all time high. That is extreme and contrarians will be taking note.
Other assets insights
EUR/USD Analysis: read now
GBP/USD Analysis: read now
USD/JPY Analysis: read now
GOLD Analysis: read now
Author

Richard Perry
Independent Analyst


