Overnight rates
S2N spotlight
Today will be the last of a deep dive series into the mechanics of money. I believe there is room for one dedicated blog post describing the flow of money from start to finish, but we will come back to that in the not too distant future.
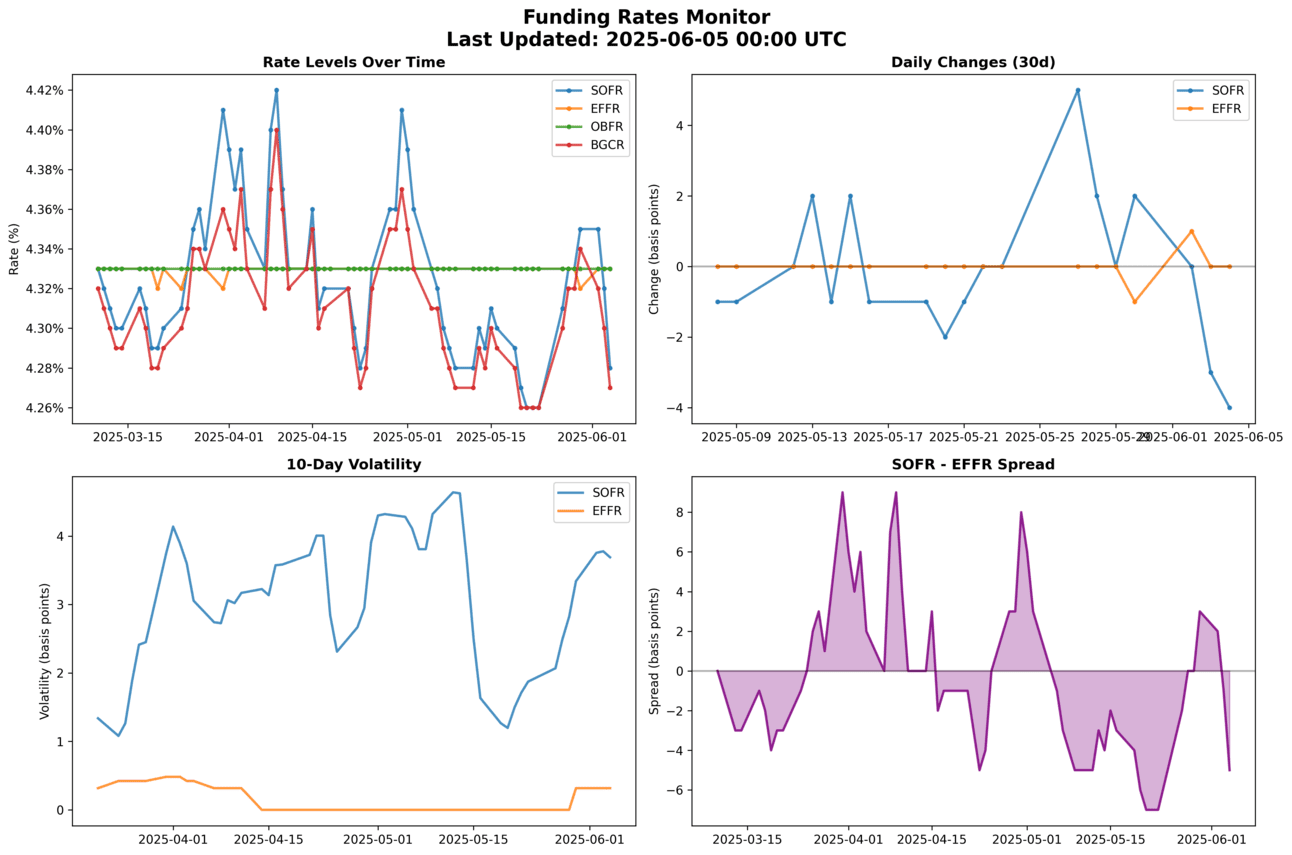
In the chart below, I’ve highlighted key interbank funding rates, with the most important being SOFR (Secured Overnight Financing Rate)—essentially the repo rate, representing the rate at which secured overnight lending against Treasuries occurs.
The EFFR (Effective Federal Funds Rate) reflects the unsecured overnight lending rate between banks on their reserve balances.
The BGCR (Broad General Collateral Rate) and OBFR (Overnight Bank Funding Rate) are included for completeness, though they are less critical to understand for our purposes.
The SOFR–EFFR spread is a key indicator of market liquidity and funding stress, measuring the divergence between secured and unsecured overnight funding conditions.
Without diving too deep, the Fed uses two main tools to keep short-term rates — especially SOFR and EFFR — within its target range:
It sets the SRF (Standing Repo Facility) rate, which acts as a ceiling, offering banks a backstop for cash against Treasury collateral.
It operates the ON RRP (Overnight Reverse Repo Facility), where it borrows cash from money market funds, creating a floor under short-term rates.
Think of it like a corridor: the Fed sets the floor (ON RRP) and the ceiling (SRF), and market rates like SOFR and EFFR bounce around in between — unless something breaks.
Fed balance sheet
The Fed’s balance sheet is spoken about all the time as it grew to $9 trillion through an interesting concept called QE (quantitative easing). It is now shrinking through QT (quantitative tightening) and is currently sitting at under $7 trillion.
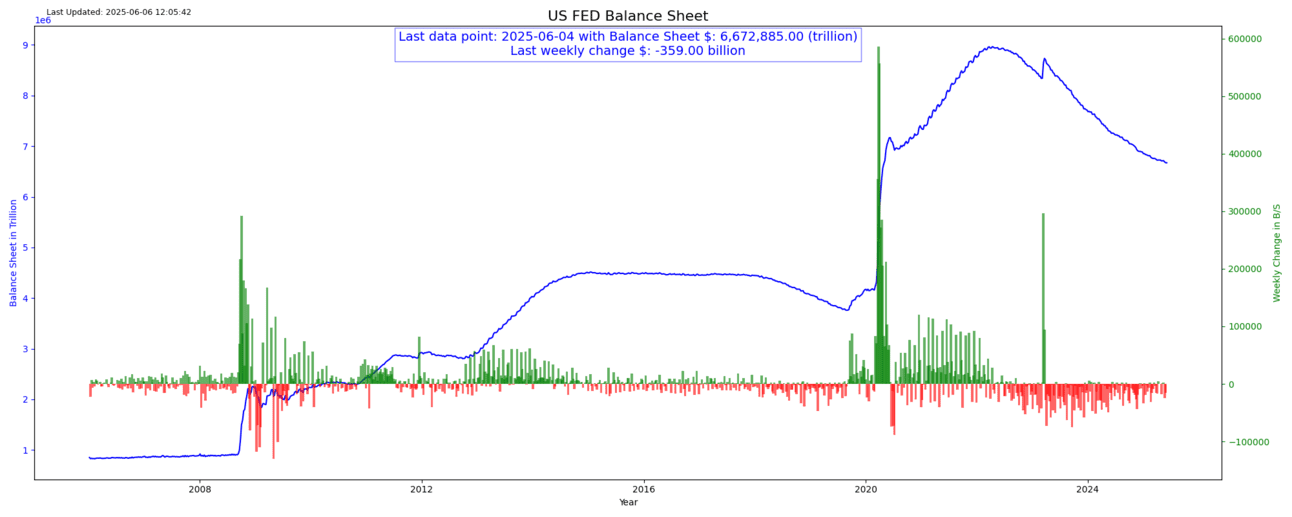
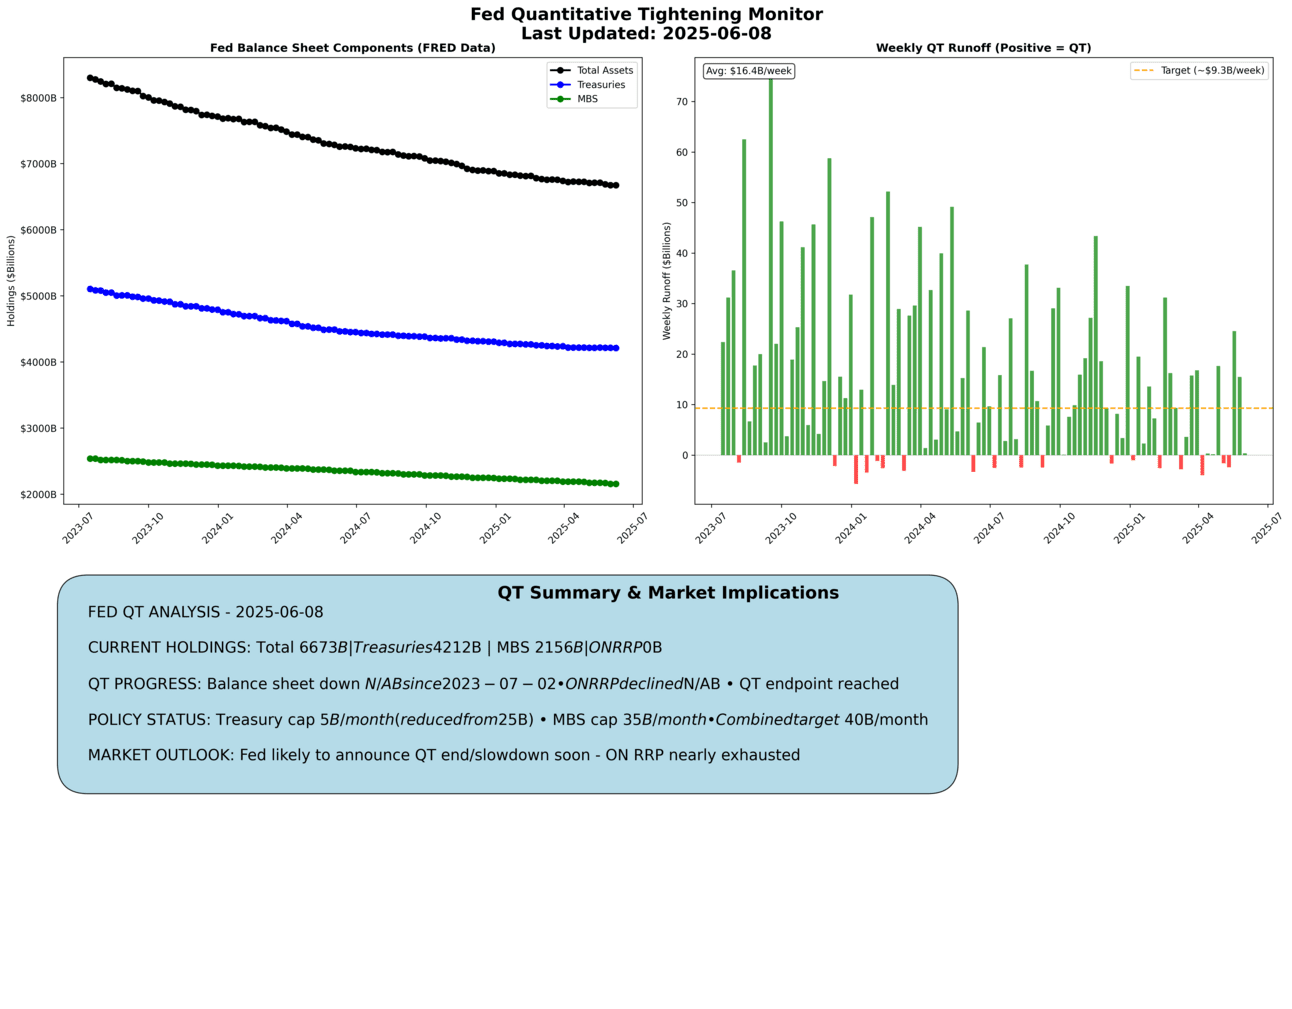
These charts are updated daily on the research portal along with all the other charts I share in the newsletter. I have decided to create a QT monitor to help us track the steady progress of the Fed reducing its balance sheet and the overall impact on the markets’ liquidity. I am dwelling on this subject because one of the main reasons we have gotten an “everything bubble” is because there has been way too much liquidity in the market. This has now spilt over into inflation and currency devaluation.
In the chart on the top right, each time the Fed’s balance sheet shrinks through runoffs, meaning that the treasuries or other fixed-income securities it holds mature, it shows as a green bar. Sometimes it still has to mop up some auction supply, as you see in the red bars, to keep the markets stable.
I will improve the wording in the summary that is now currently generated by a series of preloaded responses to certain ranges. I will make it more user-friendly.
S2N observations
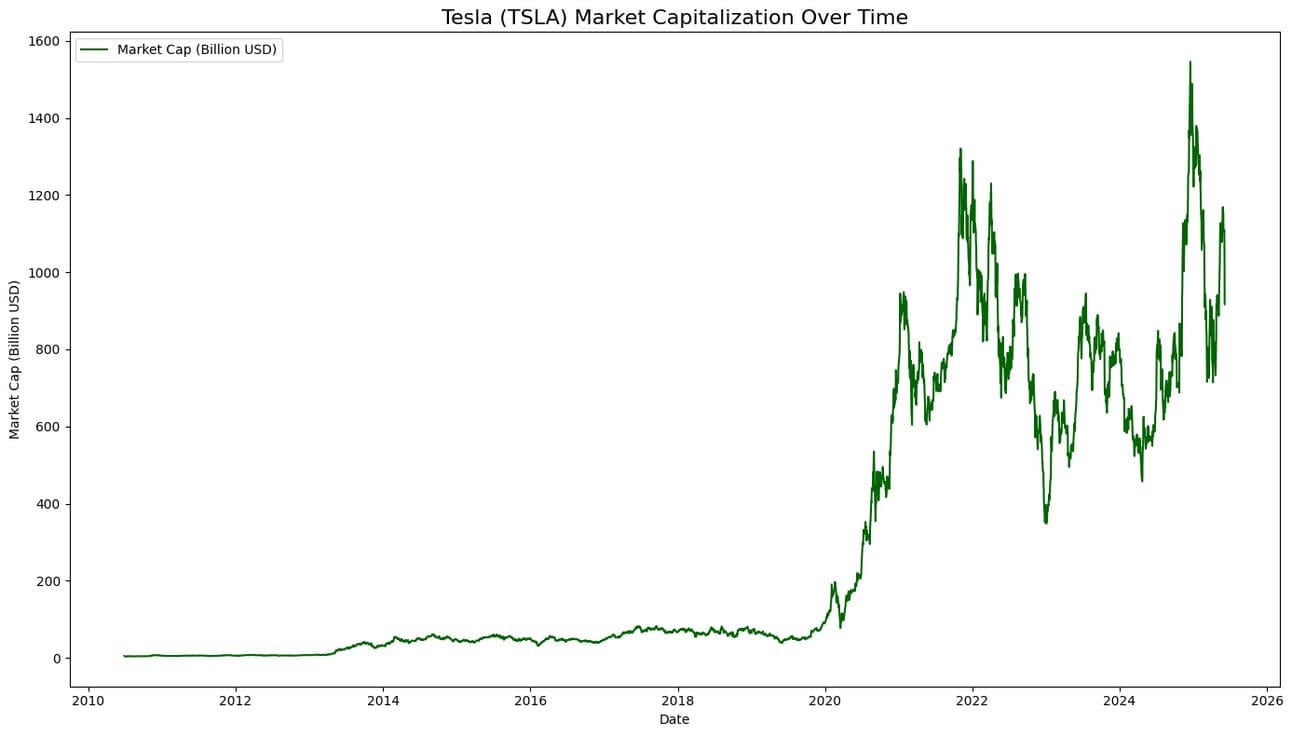
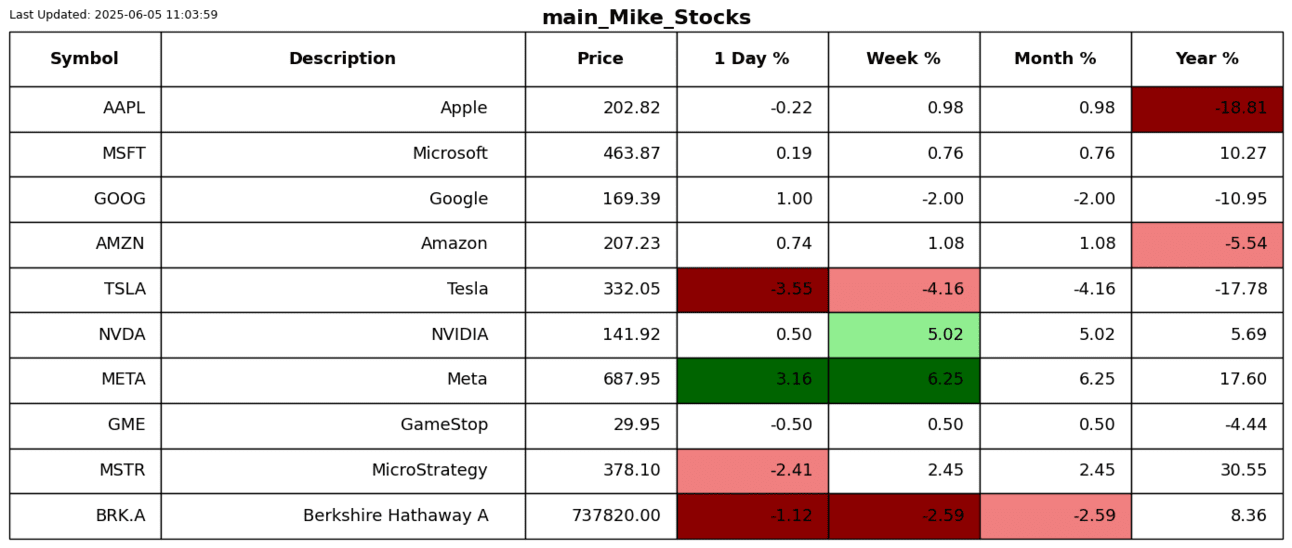
I spoke about the bromance ending yesterday; I didn’t expect to wake up to a full-blown texting war so soon. Tesla’s market cap was savaged by a painful $152 billion. I am not sure if that even bothers Musk.
I also learned a new acronym that is all over the net. TACO (Trump Always Chickens Out). I think Chairman Xi has the measure of Trump in this negotiation. Trump is doing summersaults trying to spin a good story to the public.
I found these 2 charts quite informative, which is one of the reasons I always like to plot a price journey through time; see the portal.
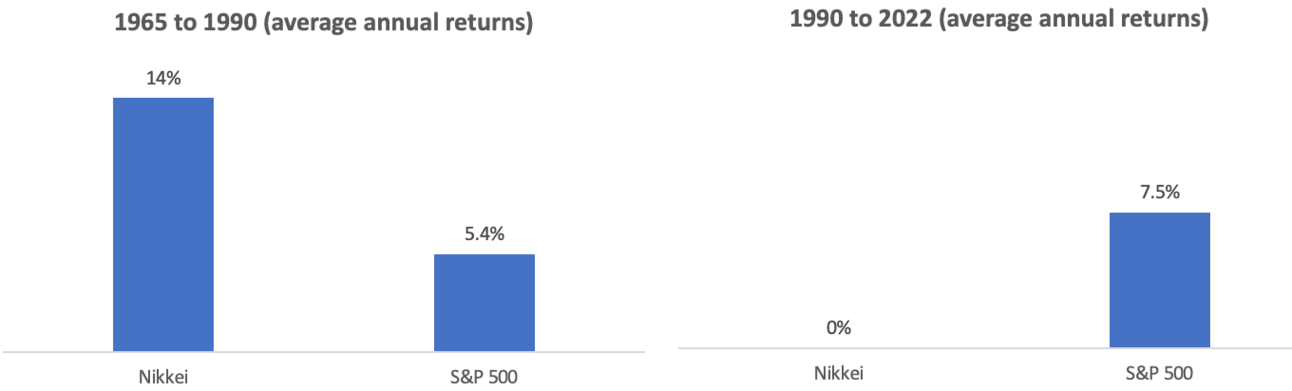
50 years of return shows the S&P 500 and the Nikkei almost tied.
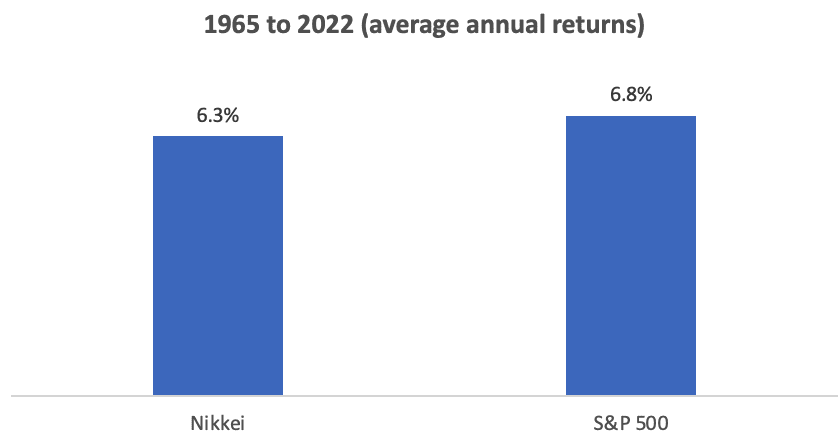
When you look at how it unfolded, you see a very different picture.
S2N screener alert
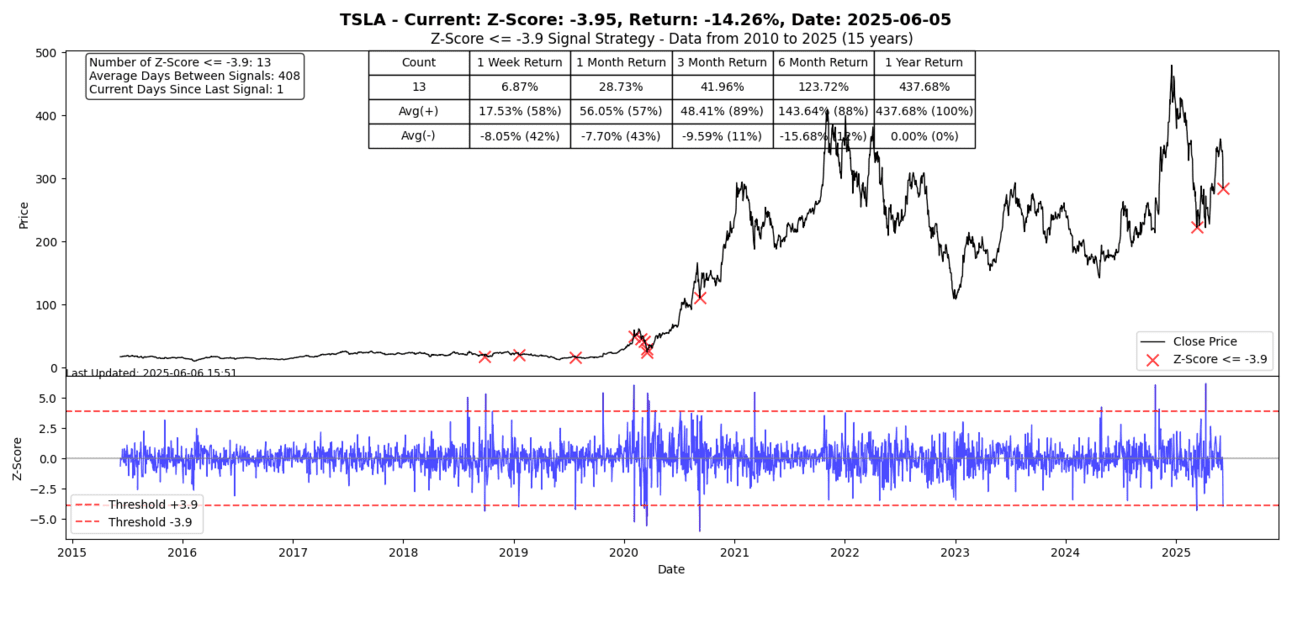
Tesla recorded a rare -3.9 Z-score, only its 13th such move in its history.
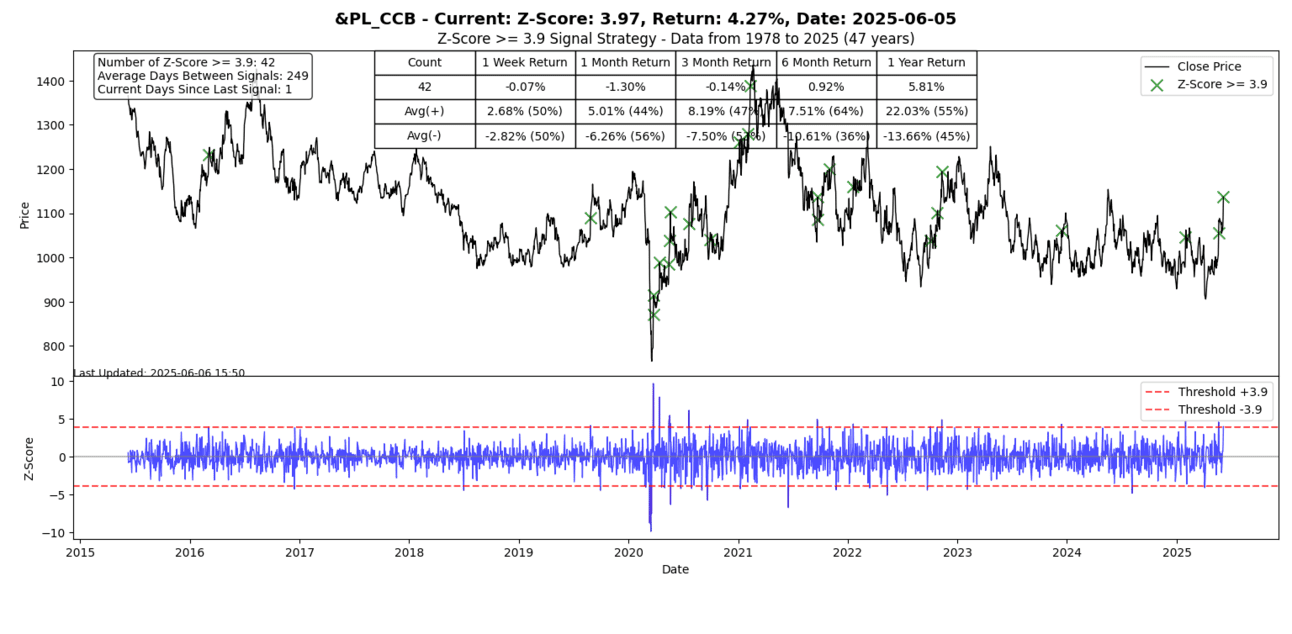
Platinum had a very strong day with a 3.97 Z-score up day.
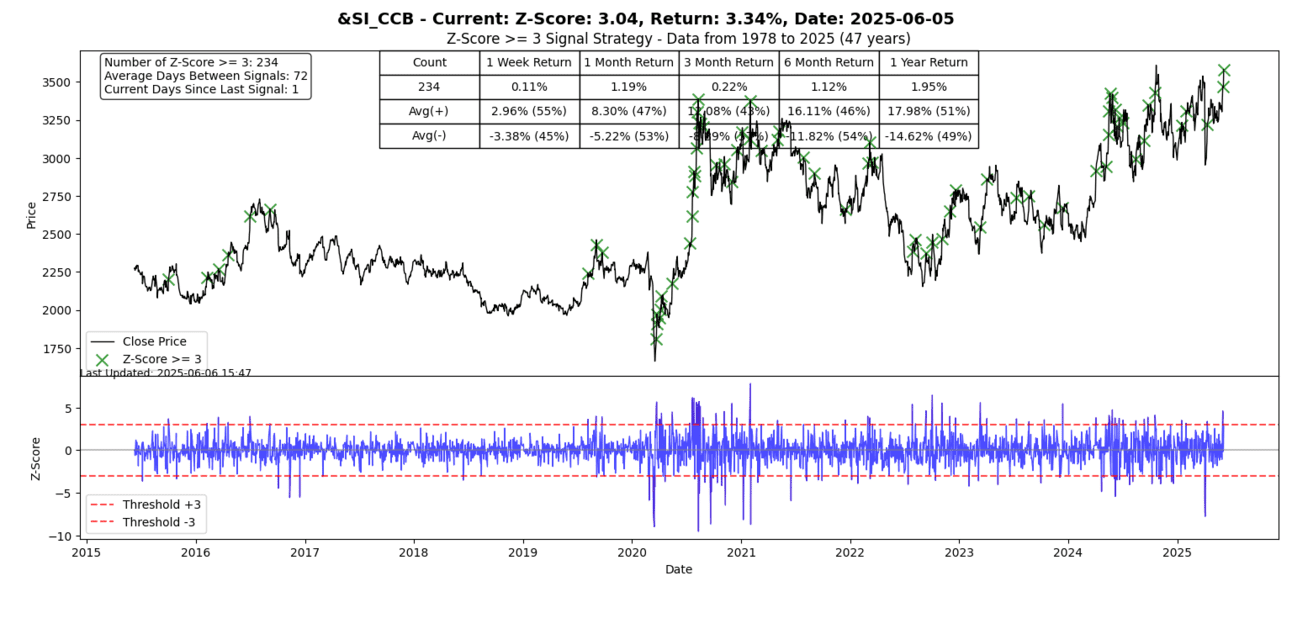
Silver also had a strong rally with a 3+ Z-score up move.
S2N performance review
S2N chart gallery
S2N news today
Author

Michael Berman, PhD
Signal2Noise (S2N) News
Michael has decades of experience as a professional trader, hedge fund manager and incubator of emerging traders.


