OPEC Agreement Doesn’t Move Markets

Good Morning Traders,
As of this writing 4 AM EST, here’s what we see:
US Dollar: Dec. USD is Down at 101.480.
Energies: January Crude is Down at 49.32.
Financials: The Dec 30 year bond is Down 32 ticks and trading at 151.21.
Indices: The December S&P 500 emini ES contract is 3 ticks Lower and trading at 2207.50.
Gold: The December gold contract is trading Down at 1169.80. Gold is 10 ticks Lower than its close.
Initial Conclusion
This is not a correlated market. The dollar is Down- and crude is Down- which is not normal and the 30 year bond is trading Down. The Financials should always correlate with the US dollar such that if the dollar is lower then bonds should follow and vice-versa. The indices are Down and Crude is trading Down which is not correlated. Gold is trading Down which is not correlated with the US dollar trading Down. I tend to believe that Gold has an inverse relationship with the US Dollar as when the US Dollar is down, Gold tends to rise in value and vice-versa. Think of it as a seesaw, when one is up the other should be down. I point this out to you to make you aware that when we don’t have a correlated market, it means something is wrong. As traders you need to be aware of this and proceed with your eyes wide open.
All of Asia traded Higher and conversely all of Europe (as of this writing) is trading Lower.
Possible Challenges To Traders Today
– Challenger Job Cuts y/y is out at 7:30 AM EST. This is major.
– Unemployment Claims is out at 8:30 AM EST. This is major.
– Final Manufacturing PMI is out at 9:45 AM EST. This is not major.
– ISM Manufacturing PMI is out at 10 AM EST. This is major.
– Construction Spending m/m is out at 10 AM EST. This is major.
– ISM Manufacturing Prices is out at 10 AM EST. This is major.
– Nat Gas Storage is out at 10:30 AM EST. This is major.
– Total Vehicle Sales – All Day. This is major.
Treasuries
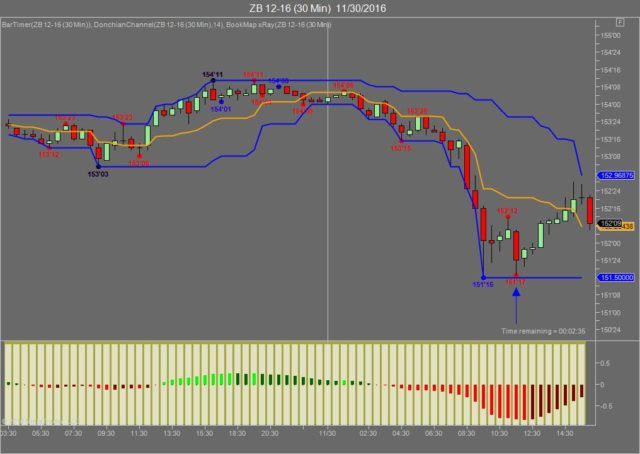
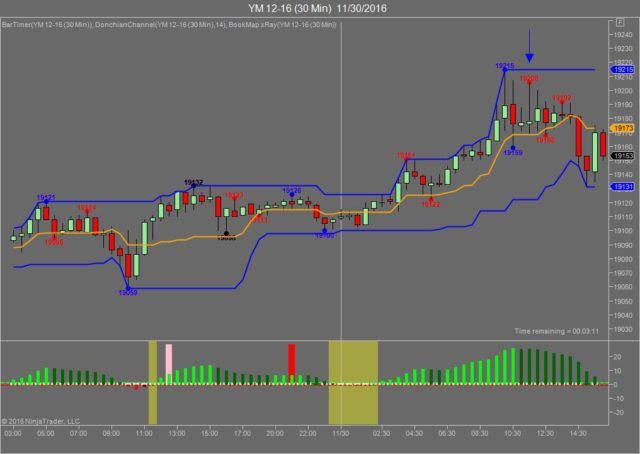
We’ve elected to switch gears a bit and show correlation between the 30 year bond (ZB) and The YM futures contract. The YM contract is the DJIA and the purpose is to show reverse correlation between the two instruments. Remember it’s liken to a seesaw, when up goes up the other should go down and vice versa.
Yesterday the ZB made it’s move at around 11:30 AM EST with no economic news in sight. The ZB hit a low at around that time and the YM hit a high. If you look at the charts below ZB gave a signal at around 11:30 AM EST and the YM was moving lower at the same time. Look at the charts below and you’ll see a pattern for both assets. ZB hit a low at around 11:30 AM EST and the YM hit a high. These charts represent the newest version of Trend Following Trades and I’ve changed the timeframe to a 30 minute chart to display better. This represented a long opportunity on the 30 year bond, as a trader you could have netted about 30 plus ticks per contract on this trade. Each tick is worth $31.25. We added a Donchian Channel to the charts to show the signals more clearly.
Charts Courtesy of Trend Following Trades built on a NinjaTrader platform
Bias
Yesterday we gave the markets an upside bias as the Bonds and Gold were both trading lower and this usually represents an upside bias for the indices. The Dow traded 2 points higher and remained in positive territory but the other indices dropped. Today we aren’t dealing with a correlated market and our bias is neutral.
Could this change? Of Course. Remember anything can happen in a volatile market.
Commentary
So finally after two years OPEC decides to cut crude oil production. Initially the markets reacted positively to this as it means that the price of crude should rise. However we’ve been telling our followers for the last two years that crude and the markets are reverse correlated meaning that when one goes up, the other should go down. Prior to two years ago they worked in tandem with one another. So given that they are now reverse correlated, what happened? The price of crude went up and guess what? The markets dropped. In fact the Dow was very much in danger of closing in negative territory and almost did but was saved by the closing bell. The Dow only advanced 2 points but the Nasdaq dropped by 56 and the S&P lost 5.
Author

Nick Mastrandrea
Market Tea Leaves


