Only Minor Top Ahead

Market overview:
We are approaching the full count from the 2500 re-accumulation level, but it is likely that we will get there through a series of fits and starts and not directly. This will be dictated by the very nature of the market itself that requires that projection targets be reached in a structured manner which is the essence of price progression. Cycles also play a complementary role and, except for a minor cycle which is on the verge of bottoming, there are none capable of moving the market appreciably to the downside and ready to make their lows imminently ahead. In fact, the soonest we can expect an important correction to start is probably still at least a couple of weeks away. In the meantime, higher prices are likely.
The steady move upward without any significant pull-back has frustrated the bears, but under the current market conditions, there is little to be done for them to grit their teeth and learn patience. The simplest way to assess what’s ahead is to look at a weekly and a daily chart. The weekly indicators are at their highest levels since last October, surpassing in height everything in-between. This is proof that the market is not nearly ready to have an important correction. Negative divergence will have to show before this happens, as it did in June 2015 and August 2016. Even the daily oscillators will need to complete a topping formation before becoming negative. They may just be starting to do this; and future trend lines will have to show deceleration by connecting lows at less steep angles. All this must happen before we can expect a good correction to take place.
Analysis: (These Charts and subsequent ones courtesy of QCharts.com)
Daily chart
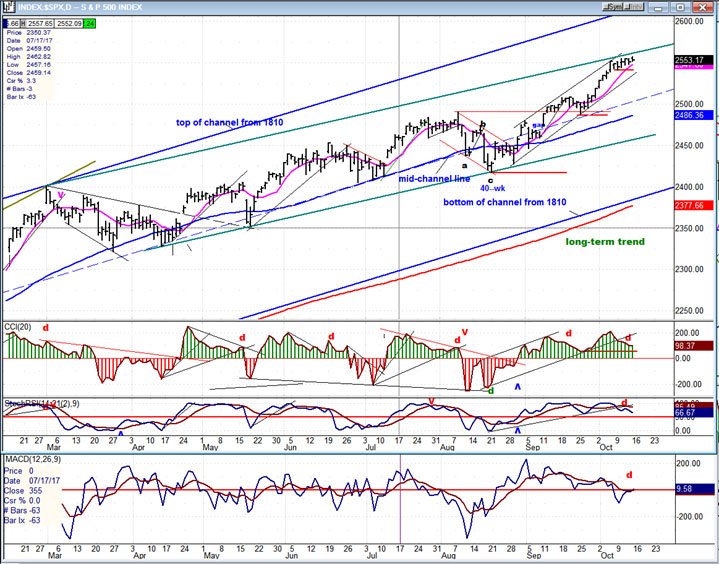
Some deceleration is appearing in the intermediate-term trend, as shown by the inability of the index to rise to the top of the blue channel, but none isevident in the short-term trend since price has risen all the way to the top of a secondary (green) channel where it is beginning to flatten out as it encounters resistance. That, and the fact that all the oscillators are showing negative divergence is an indication that a reversal is about to take place, but I would not bet on its being anything other than one of a minor nature. There is too much upside momentum and the divergence is only the result of traders not willing to step in at the very top! This privilege is reserved for those who have little market experience. But neither will experienced traders be waiting very long before buying back in. They are very much aware that little distribution has formed and therefore the anticipated pull-back cannot be all that great. Nor, as suggested in the Overview, are there any important cycles making their lows in the immediate future -- not until January. So, there is still time for the incomplete structure to complete and for distribution to form. The current level of distribution is not enough to bring about anything more than a couple dozen points on the downside, if we come down right away. There are, however, higher counts available from the 2500 level; and if you go with the odds, you should be looking for higher prices before too much happens on the downside.
Remember what I said earlier about the weekly oscillators still being in an uptrend and having to be muted before we can expect much of a reversal. Here, you can see the daily oscillators are showing divergence, but the CCI is still very high and will have to gradually drop closer to the zero line before it can be expected to go through and give a sell signal.
Hourly chart
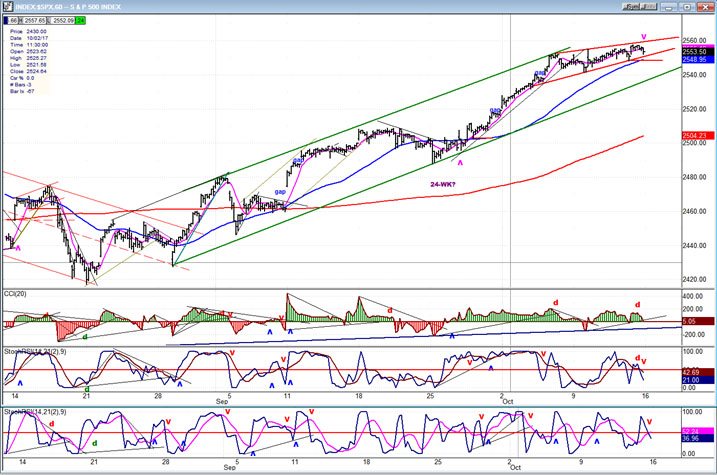
From SPX 2417 on 08/17, it has been pretty much a straight up move with only minor consolidations along the way. More of the same is expected as the index begins to roll over in preparation for making a rally high. But it won’t be right away. The strength in the higher degree time frame suggest that some deceleration will have to occur, first.
If I am correct that no important cycle is likely to bottom until January, we could push this uptrend into late November before a reversal takes place. This is just a guess. We’ll firm up the date when the market give us the advance warning that it is about to roll over.
There is a minor cycle due (ideally) early next week which could bring about a little pull-back before we move higher. On the other hand, the current phase target lies a few points higher and the index may decide to reach it first, on Monday. The oscillators, which are already declining, place the odds on the former, especially since we appear to be making a small terminal pattern. But I still would not take it for granted and would let the market speak for itself.
An overview of some important indexes (daily charts)
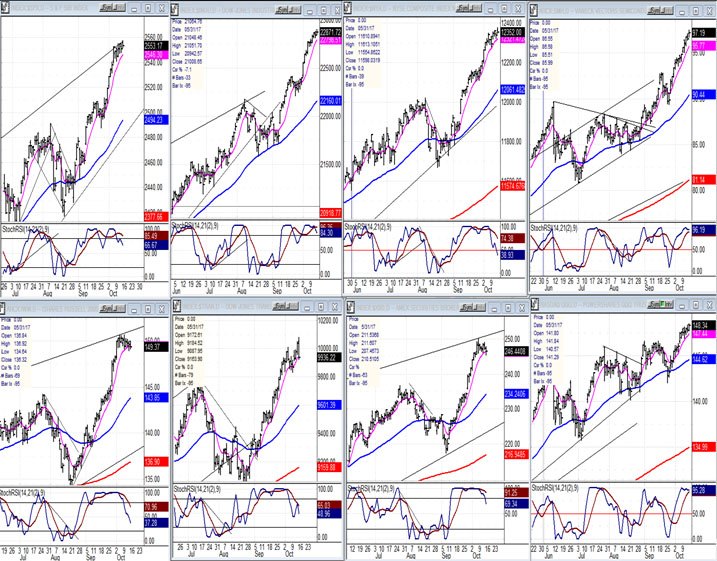
The indexes which stand out this week (in a minor way), are the IWM (lower, left), followed closely by XBD (third on the bottom). They offer the most contrast to SPX in that they have obviously been under distribution for the past two weeks, whereby others have forged ahead more forcefully. I admit that I am making a mountain out of a mole hill, but it could be an indication that the market is entering a topping zone which will become more manifest over the next couple of weeks. This does not preclude in any way that we are still in a very strong bull market which shows no sign of being close to ending.
UUP(dollar ETF)
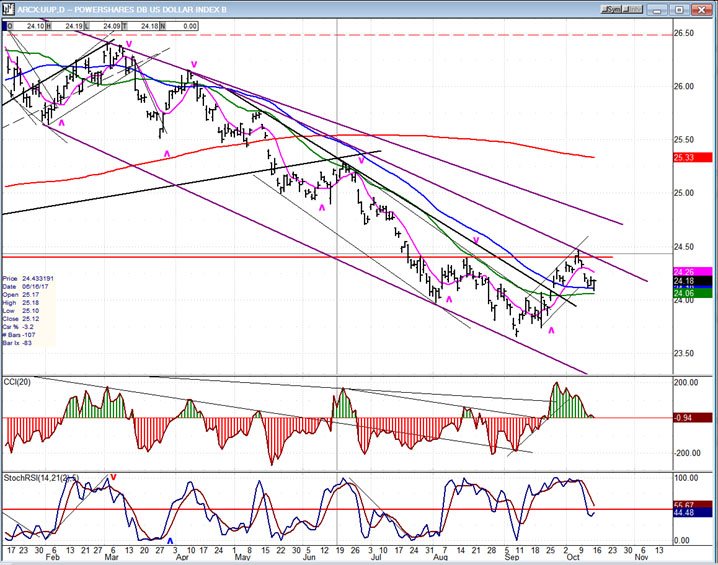
After essentially reaching its 23.50 P&F projection (23.66 low), UUP is consolidating its recent oversold bounce, and could be getting ready to extend it. Moving through the 24.50 resistance would be a positive accomplishment.
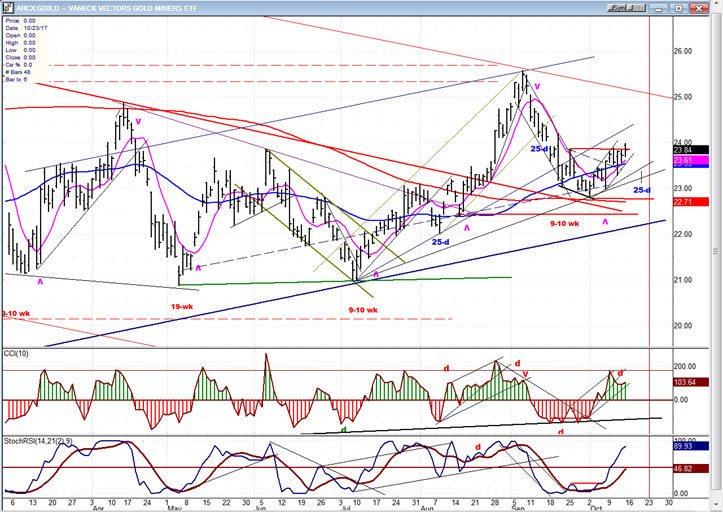
GDX (Gold Miners ETF)
GDX is at a critical level. At 23.84, it has now retraced .382 of its previous correction from the 25.58 top. It’s attempt to move higher, which is better seen on an hourly chart, was rejected on Friday. One of the reasons for this is that it has a 25-day cycle bottoming next week, which could restrain it further. The key to revealing its current position will be what it does after that cycle has made its low. If it can continue its current uptrend past 24.20, it will begin to take on a bullish tint. However, if it cannot continue its upside momentum aggressively past that level, it will be at risk of pulling back sharply into the year-end cycle lows.
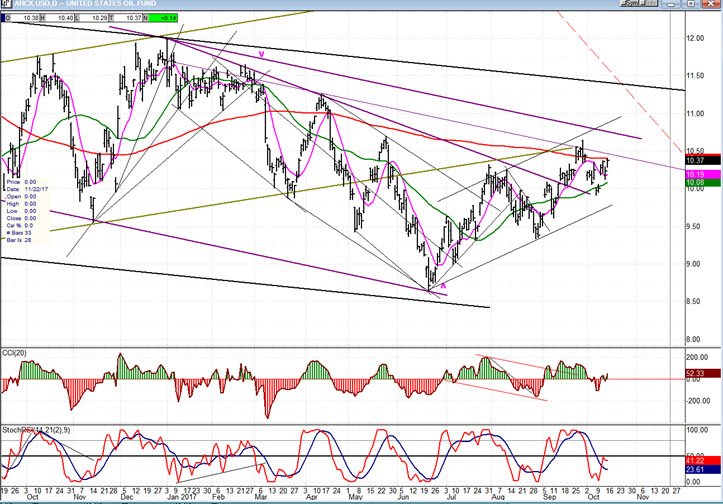
USO (United States Oil Fund)
USO has another opportunity to show that overcoming the secondary channel was not a fluke. If it can rise above the next purple downtrend line, it will have a chance to pit itself against the real resistance line which presently lies around 11.25, and which is reinforced by the overhead supply at the former top. Until USO meets that challenge successfully, it will probably continue to stagnate in a wide base formation.
Summary
There is some technical evidence that SPX is coming into a minor top (which may already have arrived), in order to comply with the bottoming of the 6-wk cycle next week --unless it first decides to push higher to fill its ca. 2565 projection.
Author

Andre Gratian
Market Turning Points
When I was a stock broker years ago, a friend introduced me to technical analysis of the market and it is not an exaggeration to say that I fell in love with this approach! Ever since then, it has become an increasingly important


