(Only) a Near-term top?

Market Overview
In the last Newsletter, I mentioned that the SPX Point & Figure chart was giving us a projection to 2800. On Tuesday, the index reached 2795 and closed at 2793, but that evening, the Trump administration announced that it was ready to impose another $200 billion tariff on China which sent prices plummeting at the next day’s opening with a close twenty points lower. However, the weakness was short-lived and we did reach our 2800 objective on Friday.
It is normal for a correction to take place after a valid count has been filled. This time looks no different! After reaching 2804.53 in the second hour of trading, buying dried up completely and prices traded in a narrow range for the rest of the day. The pattern created has the appearance of a distribution phase in preparation for a one or two day pull-back, especially since breadth deteriorated steadily throughout the session, going negative by the close.
We probably should not expect much of a correction this time; actually only a consolidation which should take us a little higher next week – as long as we do not break below 2771! But the next top may have to be taken more seriously. I will show you why during the course of this analysis.
Chart analysis (The charts that are shown below are courtesy of QCharts)
SPX daily chart
I think that we can agree that the correction has come to an end -- probably in the form of a wave-4 triangle in early May -- and that a new ( choppy) uptrend is underway. It is also clear that there is nothing immediately threatening that uptrend since there are four important uptrend lines supporting the move. However, the nature of the uptrend tells us that we should not expect straight up moves, but that the choppiness will continue. Therefore, our analysis should be geared to identifying short-term reversals. The Point & Figure chart is ideally suited to identify price targets, both short-term and long-term. When complemented with momentum and breadth indicators, as well as short-term cycles, the analysis becomes highly reliable (providing we retain our objectivity).
As an example, all of the above methodologies were projecting a near-term top at about 2800-2805. Since this objective was met on Friday, we should be prepared for a pull-back to occur as traders, who are very much aware of that target, take their profits and wait for the next buying opportunity. The manner in which the oscillators at the bottom of the chart closed on Friday adds weight to this being a reversal point. They are not only showing a topping formation, but it is accompanied by negative divergence with the A/D indicator (lowest) giving the worst reading. The cyclical element is also satisfied, but I will discuss this in more detail in myMondayintra-day updates.
The above analysis remains unconfirmed until we have a price reversal, which could come as early as Monday’s opening. Since the P&F target may only bea partial (phase) count, we have to make certain that Friday’s price activity was distribution and not accumulation, which would send us immediately to the higher target. The hourly chart, being far more sensitive than the daily, is particularly useful in identify tops and bottoms, and this is what we will analyze next.

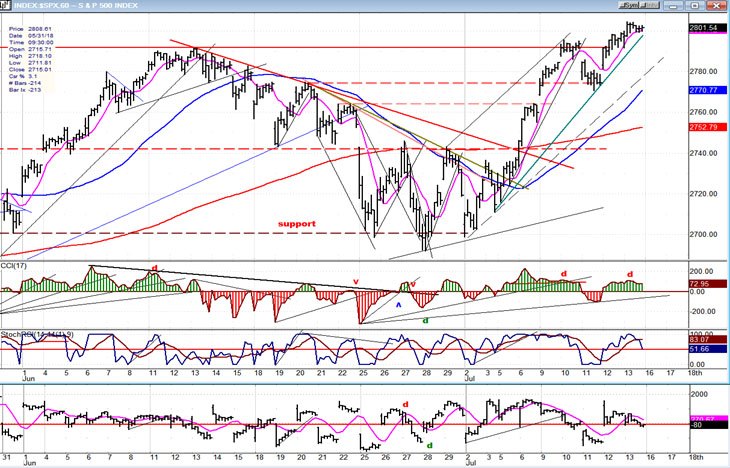
SPX hourly chart
On Friday, even though we quicklyovercame the former high, the price momentum decelerated immediately resulting in a sideways move for most of the day. Since there is no immediate overhead resistance, we have to assume that this is the result of the index having filled its count in the 2800 vicinity. If we look at the last near-term top, we had essentially the same action and it was followed the next day by a decline. The reason may be different this time, but the action will probably be the same.
Also, last time the price action crowded the uptrend line and when it went outside of it, a reversal occurred. This would be our clue again this time; a break of the green trend line would lead to a reversal! Looking at the top oscillator, the last reversal was preceded by divergence. We had the same condition on Friday, so it would not be surprising to get a sell signal on Monday.
Although the divergence is showing at the daily level, I am assuming that this pull-back will be limited and will hold above the dashed trend line which is now support. If we only have a minor correction this time, the entire base does call for a move a little higher and this is what we should expect providing we remain above the dashed trend line. If one occurs,the next top is the one we should really be concerned with for the reason I am going to show you in the next two sections.
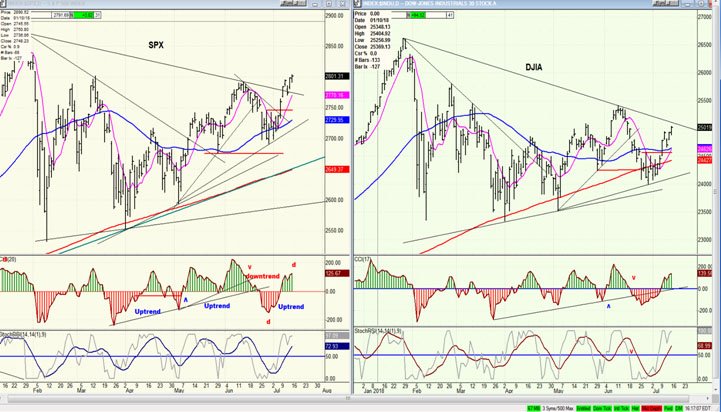
SPX vs DJIA (daily charts)
This is an update of last week’s charts. SPX made a new high, but the same relative weakness still shows in the DJIA. Also, (last week) I mentioned that the divergence which showed in the top oscillator at the last low would probably be replicated in the oscillator top this week. This is what happened and, since we know that divergence in oscillators = reversal in price the majority of the time, this also suggests that a price reversal is imminent.
The reason for this relative strength in SPX is because it is greatly influenced by NDX stocks.But this does not lessen the forecasting value of the relative price comparison. The NDX is at an all-time high and very overbought. Furthermove, its oscillators are showing negative divergence at the hourly chart, the daily chart, and even the weekly chart! “Caveat emptor”
TRAN, SPX, IWM (daily)
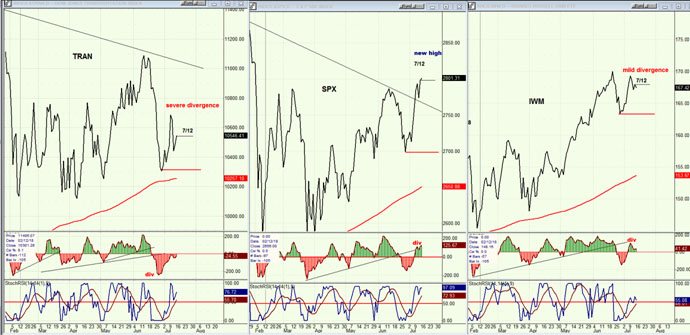
On these graphs, I am using line charts to show the divergences in other indexes more clearly. I mentioned before that the relative weakness of the TRAN and IWM to SPX appear to be indicative of a market top. The IWM has been stronger than SPX except for last Friday’s top which shows mild divergence only, whereby TRAN is showing severe divergence. Either way, this divergence is ostensibly a sign that a top is forming in SPX.The analysis of the SPX charts (above) only indicatesthat we should be at a minor top. Let’s see if this is all we get. My concern is that TRAN(as well DJIA, in the above section) is warning us that a more important reversal is coming soon.
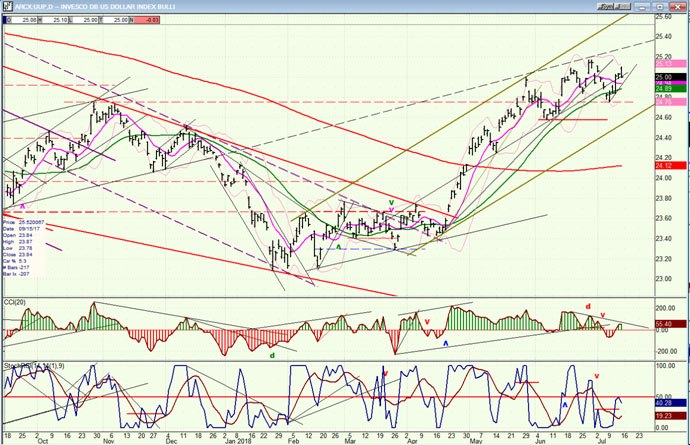
UUP (dollar ETF) Weekly
UUP is either re-testing its recent high, which would lead to a correction if it fails to make a new high and falls below 24.60 or, it has not yet completed its uptrend which, according to the P&F chart, has a potential of going to 25.50. A pull-back to 24.75, and even 24.60 would not be enough to confirm a reversal. Only a move outside of its channel in conjunction with a clear break of 24.60 would warn that an intermediate reversal has occurred.
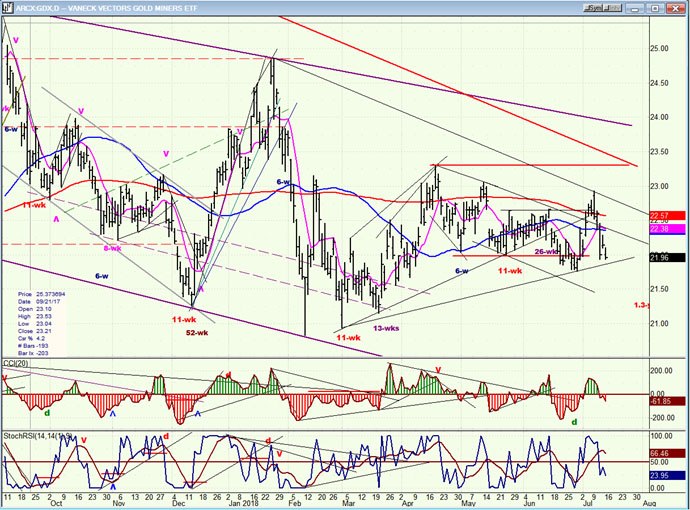
GDX (Gold miners ETF)
GDX continues to be subservient to the action in UUP.Historically,it tends to move in opposite direction to UUP, but it is not always synchronized exactly. For this reason, it is best to analyze GDX on its own but keep a loose awareness of what UUP is doing.
GDX is currently retesting its recent low, and if it can hold at this level and turn up, it would be a bullish sign, especially now that positive divergence is beginning to appear in the oscillators.
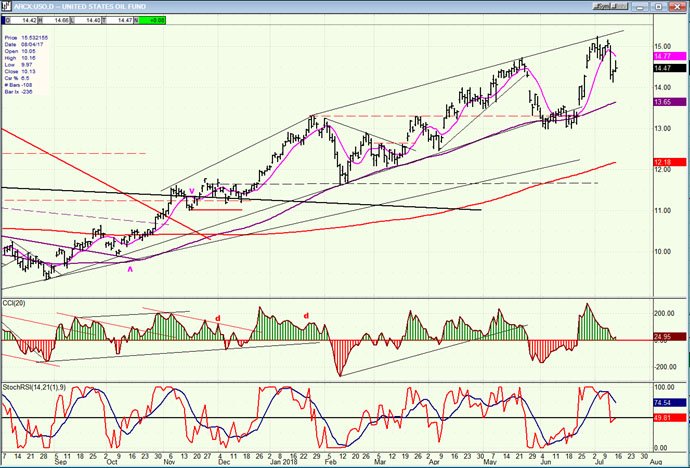
USO (United States Oil Fund)
USO has pulled back after finding resistance at the top of its channel. Since no sell signal has been given, it could retest the high and perhaps even go slightly higher before correcting.
Summary
Chart and indicator patterns are warning of what is expected to be a near-term top which has the potential of escalating into something more severe.
Author

Andre Gratian
Market Turning Points
When I was a stock broker years ago, a friend introduced me to technical analysis of the market and it is not an exaggeration to say that I fell in love with this approach! Ever since then, it has become an increasingly important


