One Year after QT Started, Gold Still Unmoved

It was supposed to make gold rally. We mean, of course, the quantitative tightening. But one year after it started, the yellow metal still does not shine. We invite you to read our detailed analysis of the Fed’s balance sheet unwind and find out what does it imply for the gold market.
One Year after QT Started, Gold Still Unmoved
Anniversaries, anniversaries everywhere. The analysts focus on the 10-year anniversary of the Lehman Bankruptcy which lead to the Global Financial Crisis and the Great Recession (we have covered this issue in the previous section of this edition of the Market Overview), neglecting another important anniversary. In October 2017, the Fed started unwinding its massive balance sheet. Although the process of quantitative tightening began slowly and with some problems (the balance sheet has even increased initially), the US central bank managed to reduce the amount of its assets, as the chart below shows.
Chart 1: Fed’s balance sheet (in trillions of $) from October 2007 to September 2018.
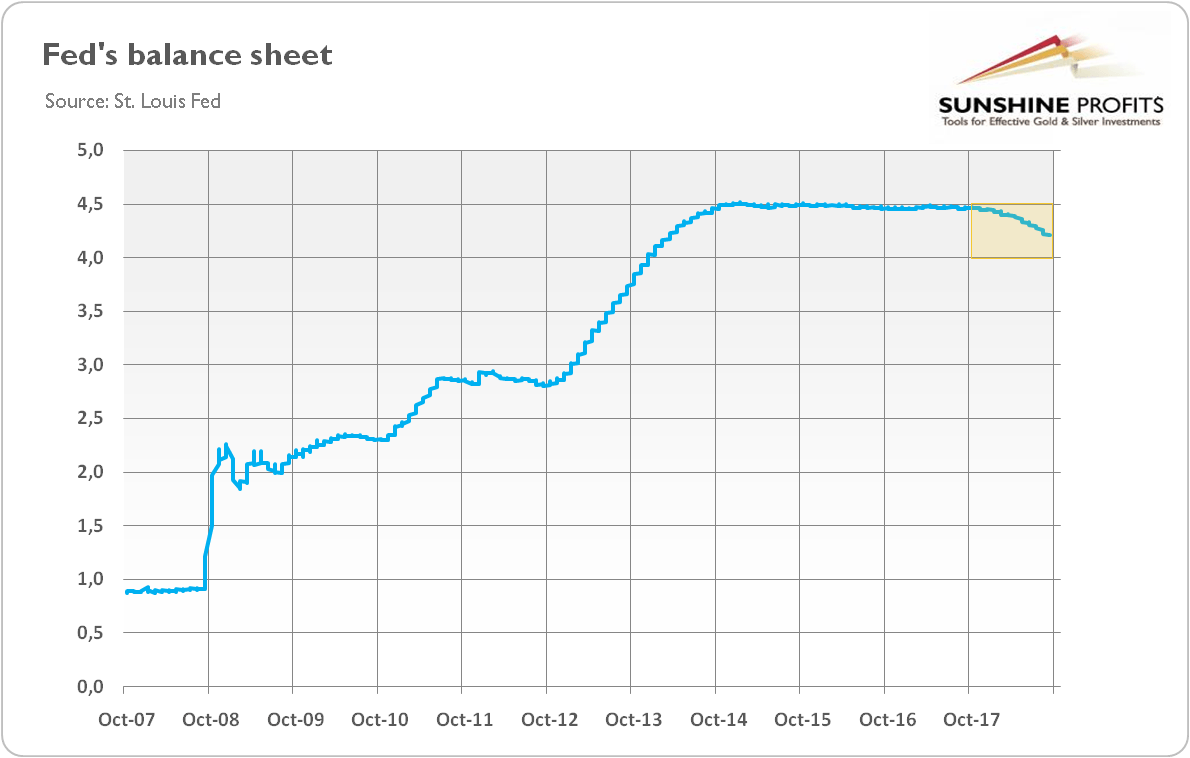
As one can see, the Fed shrank its balance sheet from about $4.46 to about $4.21 trillion. It means a reduction of $250 billion over a year. Hence, the Fed conducts its plan of unwinding generally in line with the original plan. As a reminder, the US central bank announced that it would remove $300 billion over twelve months.
What is important, as we predicted in previous editions of the Market Overview, and contrary to many gloomy prophecies, the Fed’s normalization of its monetary policy has been running smoothly so far. Theoretically, there is a risk that it could change this month, as the caps on securities reductions reached their maximum amounts. It means that since October 2019, the Fed will remove $50 billion per month until it judges that the size of its assets is appropriate. So over the next twelve months, the US central bank will remove $600 billion, twice as much as in the first year of operation.
However, the whole process was well telegraphed, and it will still remain gradual. Moreover, the Fed is reducing its balance sheet without actually selling any securities, just allowing them to mature, so we do not expect any significant perturbations on the way.
But the effects will, of course, depend on the duration and scale of the reduction in the Fed’s portfolio. How long will the normalization of the US central bank’s balance sheet take? According to the St. Louis Fed, the traditional, conventional Fed’s portfolio amounts to about $2.42 trillion. It implies that the US central bank has to remove securities worth $1.79 trillion, which it bought as part of the unconventional monetary policy. It will take three years, unless something happens in the meantime, disrupting the process (however, please note that the Fed did not alter the whole process even during the stock market sell-off in early 2018.
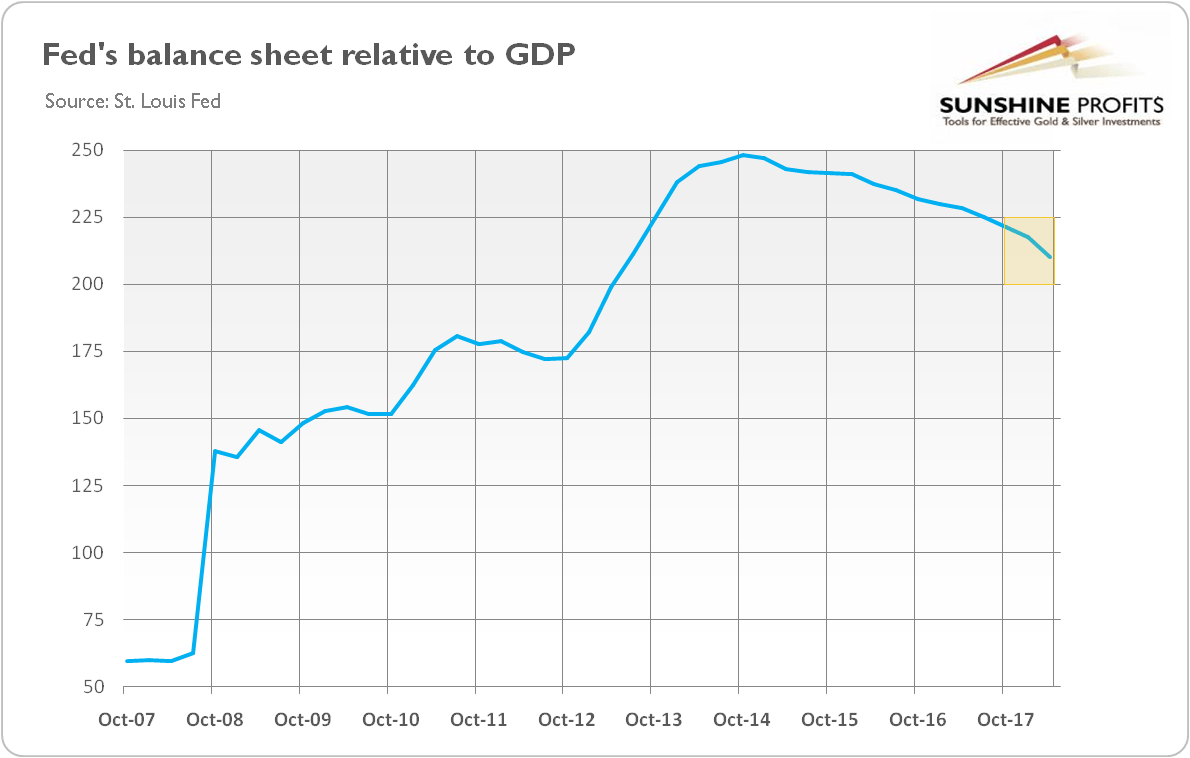
Actually, the unwinding of quantitative easing may take even less time, if the US economy continues to grow at relatively solid pace. This is because the relative size of the Fed’s balance sheet to the GDP should decline faster than the absolute amount. So far, it declined from about 225% in Q3 2017 to about 200 percent in Q2 2018, as one can see in the chart below. Investors should not forget that the US central bank will naturally have higher liabilities than it did 10 years ago due to the economic growth and the increase in demand for currency.
Chart 2: Fed’s balance sheet as a % of GDP from Q3 2007 to Q2 2018.
What does it all mean for the gold market? Well, many analysts worry that the quantitative tightening will withdraw the liquidity from the market, generating problems or even triggering crisis. But the truth is that the US banking system is still awash with liquidity.
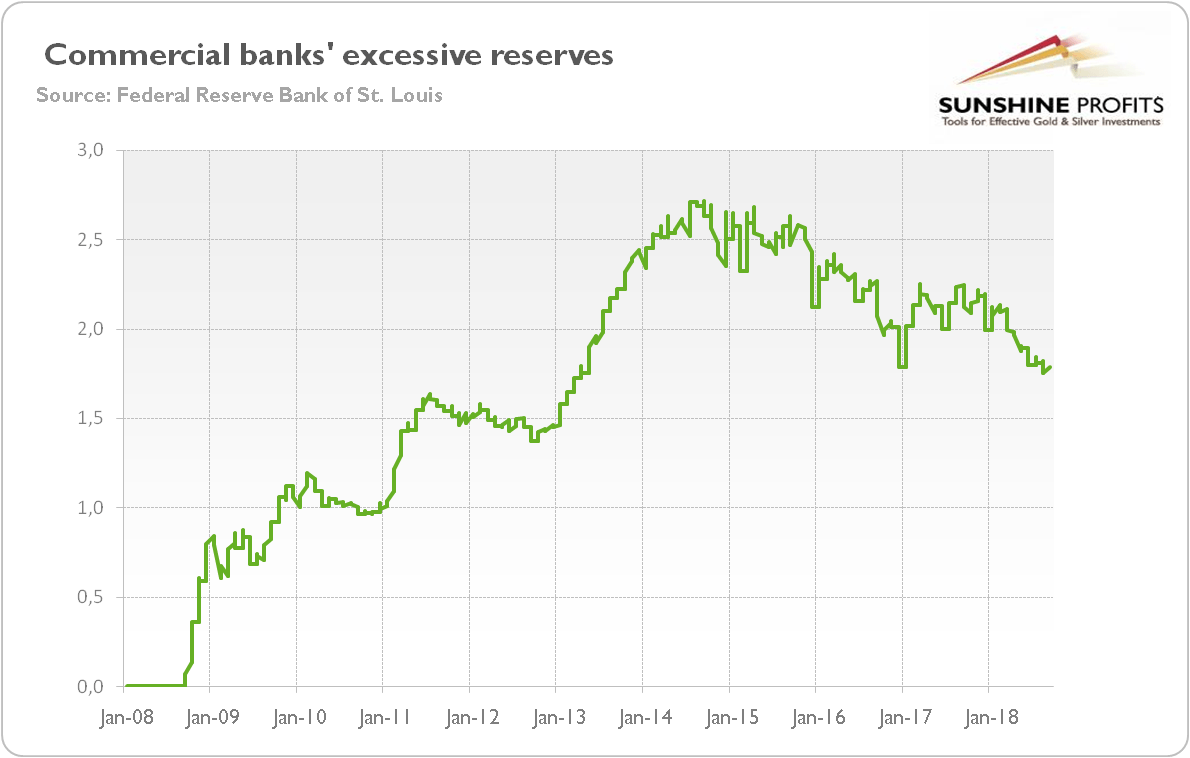
Just look at the chart below. Although their amount has recently significantly dropped, the commercial banks have still almost $1.8 trillion of excessive reserves. There are two implications: first, the Fed may continue safely the process of its balance sheet normalization; second, the quantitative tightening should not cause the liquidity crisis, at least not yet, which may be disappointing for the gold bugs.
Chart 3: Excess reserves of US depositary institutions (trillions of dollars) from January 2008 to September 2018.
Please also note that the QE unwinding will decrease the Fed’s position and increase the share on the private investors in the asset markets. As the US central bank will not reinvest any proceeds back into Treasuries, it will increase the availability of top-notch collateral for the financial markets, which could actually lubricate them. This is because the reserves remained idle, but collateral may be reused, exerting actually an easing effect.
Last but not least, the quantitative tightening is likely to drive bond yields up at the margin and be a tailwind for the US dollar. The stronger greenback and higher interest rates should exert downward pressure on the gold prices. Hence, the normalization of the Fed’s balance sheet not only will not help the yellow metal, but it could actually be a headwind.
Want free follow-ups to the above article and details not available to 99%+ investors? Sign up to our free newsletter today!
Author

Arkadiusz Sieroń
Sunshine Profits
Arkadiusz Sieroń received his Ph.D. in economics in 2016 (his doctoral thesis was about Cantillon effects), and has been an assistant professor at the Institute of Economic Sciences at the University of Wrocław since 2017.


