|

One Way to Tell If Bear Now Rules

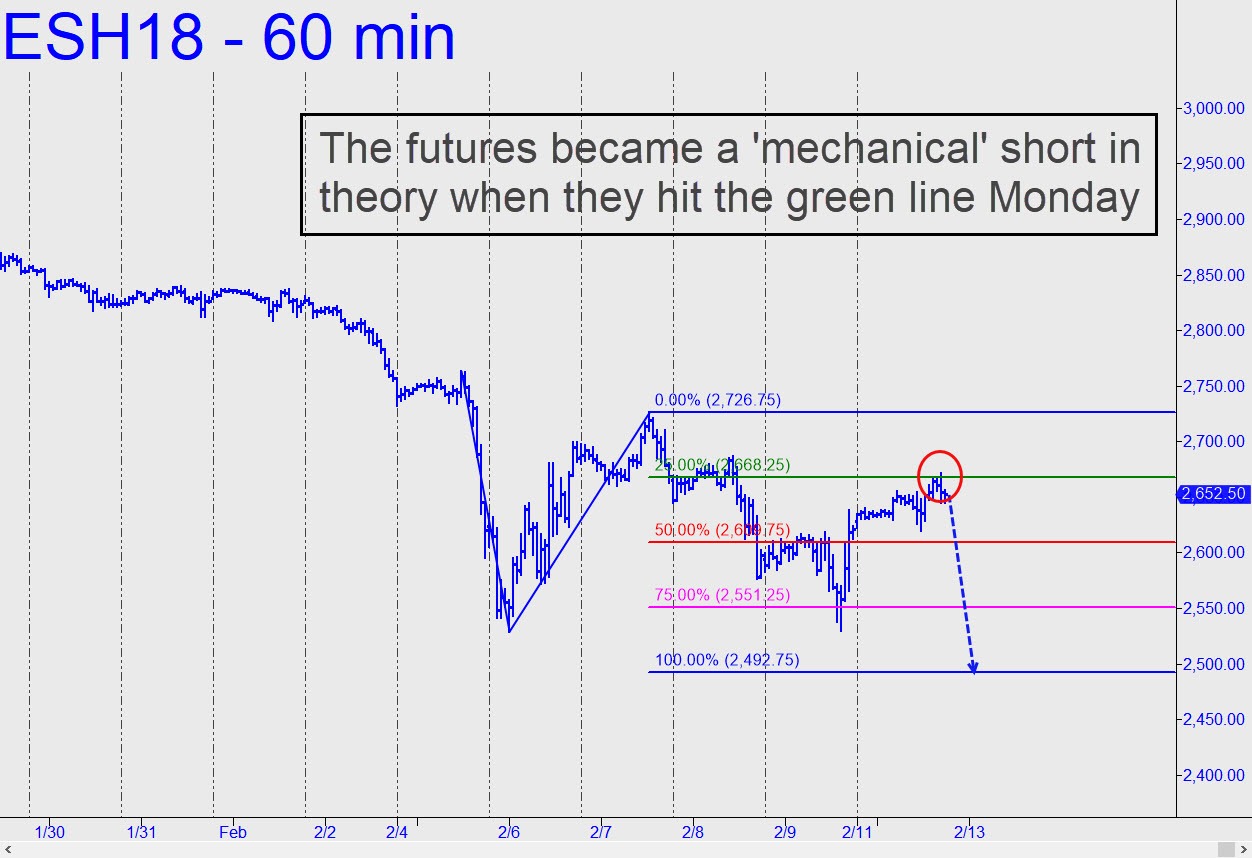
Today’s chart is the one I’ve been trading for the last week.  It is bearish, with an unfulfilled downside target at 2492.75 and a worst-case low of 2377.25. If you play it strictly by the Hidden Pivot rule book, the futures became a ‘mechanical’ short when they rallied to the green line (2668.25) near the end of Monday’s session. Since the trade calls for a stop-loss at 2727.00 that would risk nearly $3000 per contract initially, I would tend to use charts of much smaller degree, ‘camouflage’-style, to pare the risk of getting short to more like $60-$100 theoretical. I offer the chart not for your explicit trading guidance, but to allow you to see more clearly the bearish framework within which the rally from Friday’s low has proceeded. I am not persuaded strongly either way as to whether a bear market has begun, although my gut instinct leans in that direction at the moment. I would feel more strongly about it if: 1) the mechanical short from 2668.25 goes on to become a big winner; and, 2) the implied downdraft easily exceeds the 2492.75 target. In any case, I will continue to trust my technical runes above all, since they are free of the emotions and dubious citations of fact that are dominating public debate right now. From a practical standpoint, getting a good read on the bull/bear will require paying attention to one simple piece of evidence, to wit: If downtrending, ABC-type corrections start to exceed their ‘D’ targets, and upward ABC patterns start to fall short of theirs, that would shorten the odds that we are indeed in a bear market. Stay tuned if you care.

ESH

Author

Rick Ackerman

Rick Ackerman

Rick’s Picks

Barron’s once labeled Rick Ackerman an “intrepid trader” in a headline that alluded to his key role in solving a notorious pill-tampering case.

More from Rick Ackerman
Share:

Editor's Picks

EUR/USD: US Dollar to remain pressured until uncertainty fog dissipates

Unimpressive European Central Bank left monetary policy unchanged for the fifth consecutive meeting. The United States first-tier employment and inflation data is scheduled for the second week of February. EUR/USD battles to remain afloat above 1.1800, sellers moving to the sidelines.

GBP/USD reclaims 1.3600 and above

GBP/USD reverses two straight days of losses, surpassing the key 1.3600 yardstick on Friday. Cable’s rebound comes as the Greenback slips away from two-week highs in response to some profit-taking mood and speculation of Fed rate cuts. In addition, hawkish comments from the BoE’s Pill are also collaborating with the quid’s improvement.

Gold holds gains near $5,000 as China's gold buying drives demand

Gold price clings to the latest uptick near $5,000 in Asian trading on Monday. The precious metal holds its recovery amid a weaker US Dollar and rising demand from the Chinese central bank. The delayed release of the US employment report for January will be in the spotlight later this week.

Week ahead: US NFP and CPI data to shake Fed cut bets, Japan election looms

US NFP and CPI data awaited after Warsh’s nomination as Fed chief. Yen traders lock gaze on Sunday’s snap election. UK and Eurozone Q4 GDP data also on the agenda. China CPI and PPI could reveal more weakness in domestic demand.

Three scenarios for Japanese Yen ahead of snap election

The latest polls point to a dominant win for the ruling bloc at the upcoming Japanese snap election. The larger Sanae Takaichi’s mandate, the more investors fear faster implementation of tax cuts and spending plans. 

XRP rally extends as modest ETF inflows support recovery

Ripple is accelerating its recovery, trading above $1.36 at the time of writing on Friday, as investors adjust their positions following a turbulent week in the broader crypto market. The remittance token is up over 21% from its intraday low of $1.12.