One Day Up, Next Day…[Video]
![One Day Up, Next Day…[Video]](https://editorial.fxstreet.com/images/Markets/Currencies/Majors/DollarIndex/financial-planning-calculator-twenties-1784220_XtraLarge.jpg)
US Dollar: Sept USD is Up at 97.495.
Energies: Sept '19 Crude is Down at 53.74.
Financials: The Sept 30 year bond is Up 26 ticks and trading at 162.03.
Indices: The Sept S&P 500 emini ES contract is 43 ticks Lower and trading at 2909.00.
Gold: The Dec Gold contract is trading Up at 1510.40 Gold is 19 ticks Higher than its close.
Initial Conclusion
This is not a correlated market. The dollar is Up+ and Crude is Down which is normal and the 30 year Bond is trading Higher. The Financials should always correlate with the US dollar such that if the dollar is lower then bonds should follow and vice-versa. The S&P is Lower and Crude is trading Lower which is not correlated. Gold is trading Higher which is not correlated with the US dollar trading Up. I tend to believe that Gold has an inverse relationship with the US Dollar as when the US Dollar is down, Gold tends to rise in value and vice-versa. Think of it as a seesaw, when one is up the other should be down. I point this out to you to make you aware that when we don't have a correlated market, it means something is wrong. As traders you need to be aware of this and proceed with your eyes wide open.
Currently Asia is trading Mixed with half the exchanges trading Higher and the other half Lower. At this time Europe is trading Mixed as well.
Possible Challenges To Traders Today
-
Federal Budget Balance is out at 2 PM EST. This is major.
-
Lack of major economic news.
Treasuries
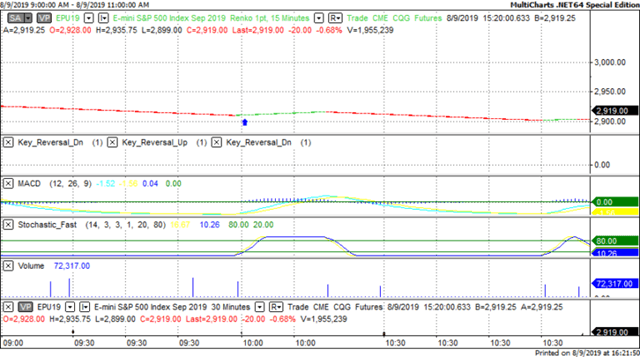
We've elected to switch gears a bit and show correlation between the 30 year bond (ZB) and The YM futures contract. The YM contract is the DJIA and the purpose is to show reverse correlation between the two instruments. Remember it's liken to a seesaw, when up goes up the other should go down and vice versa.
On Friday the ZB made a major move at around 10 AM EST. The ZB hit a High at around that time and the YM hit a Low. If you look at the charts below ZB gave a signal at around 10 AM EST and the YM was moving Higher at the same time. Look at the charts below and you'll see a pattern for both assets. ZB hit a High at around 10 AM and the YM was moving Higher at the same time. These charts represent the newest version of MultiCharts and I've changed the timeframe to a 15 minute chart to display better. This represented a Shorting opportunity on the 30 year bond, as a trader you could have netted about 20 plus ticks per contract on this trade. Each tick is worth $31.25. Please note: the front month for both the ZB and YM contract is now September, 2019 and I've changed the format to Renko bars such that it may be more apparent and visible.
Charts Courtesy of MultiCharts built on an AMP platform.
Bias
On Friday we gave the markets a Downside bias as the USD, Bonds and Gold were all trading Higher Friday morning and this bodes well for a Downside day. The markets didn't disappoint as the Dow dropped 91 points and the other indices lost ground as well. Today we aren't dealing with a correlated market and our bias is to the Downside.
Could this change? Of Course. Remember anything can happen in a volatile market.
Commentary
Friday morning we knew something was amiss as all the instruments we use for Market Correlation purposes were trading Higher except the S&P which was trading Lower. Now ordinarily I might call it a Neutral day except the fact that the indices themselves (Dow, S&P, etc.) were all pointing Lower which suggested a Downside day and in fact this was proven Friday as the markets closed Lower. Today we only have Federal Budget Balance at 2 PM, other than that nothing else.
Author

Nick Mastrandrea
Market Tea Leaves


