US Dollar: Dec. USD is Up at 94.860.

Energies: Nov '18 Crude is Up at 72.17.

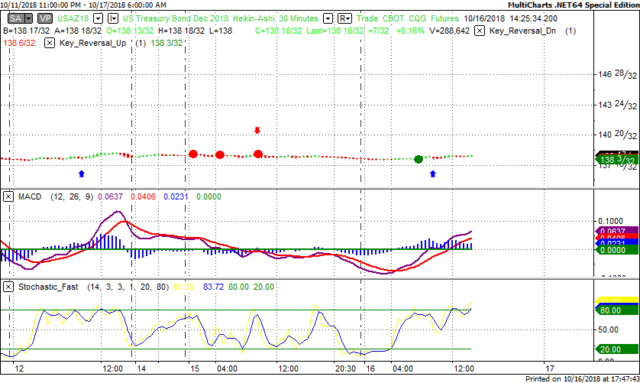
Financials: The Dec 30 year bond is Down 4 ticks and trading at 138.12.

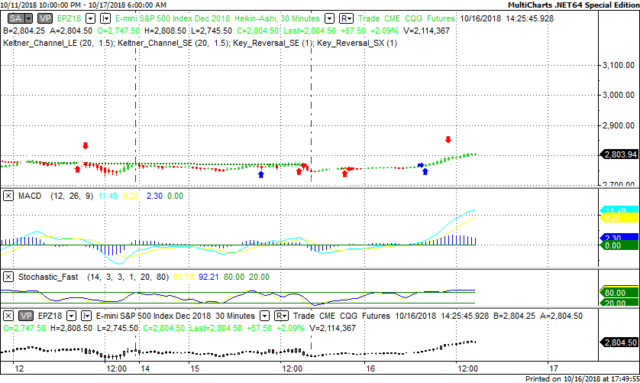
Indices: The Dec S&P 500 emini ES contract is 10 ticks Lower and trading at 2815.25.

Gold: The Dec Gold contract is trading Down- at 1227.70. Gold is 35 ticks Lower than its close.

Initial Conclusion

This is not a correlated market.  The dollar is Up+ and Crude is Up+  which is not normal but the 30 year Bond is trading Lower.  The Financials should always correlate with the US dollar such that if the dollar is lower then bonds should follow and vice-versa. The S&P is Lower and Crude is trading Higher which is correlated. Gold is trading Down-  which is correlated with the US dollar trading Higher.   I tend to believe that Gold has an inverse relationship with the US Dollar as when the US Dollar is down, Gold tends to rise in value and vice-versa. Think of it as a seesaw, when one is up the other should be down. I point this out to you to make you aware that when we don't have a correlated market, it means something is wrong. As traders you need to be aware of this and proceed with your eyes wide open.

At this hour all of Asia is trading Higher with the exception of the Indian Sensex which is Lower at this time.  Currently Europe is trading Higher with the exception of the German Dax and Spanish IBEX exchanges which are Lower at this time.

Possible Challenges To Traders Today

  • Building Permits are out at 8:30 AM EST.  This is major.

  • Housing Starts are out at 8:30 AM EST.  This is major.

  • Crude Oil Inventories are out at 10:30 AM.  This is major.

  • FOMC Member Brainard Speaks at 12:10 AM.  This is major.

  • FOMC Meeting Minutes are out at 2 PM EST.  This is major.

  • Treasury Currency Report is out.  This is Major.

 Treasuries

We've elected to switch gears a bit and show correlation between the 30 year bond (ZB) and The YM futures contract.  The YM contract is the DJIA and the purpose is to show reverse correlation between the two instruments.  Remember it's liken to a seesaw, when up goes up the other should go down and vice versa.

Yesterday the ZB made it's move at around 9:30 AM EST.  The ZB hit a Low at around that time and the YM hit a High.  If you look at the charts below ZB gave a signal at around 9:30 AM EST and the YM was moving Lower at the same time. Look at the charts below and you'll see a pattern for both assets. ZB hit a Low at around 9:30 AM and the YM was moving Lower at the same time.  These charts represent the newest version of MultiCharts and I've changed the timeframe to a 30 minute chart to display better.  This represented a Long opportunity on the 30 year bond, as a trader you could have netted about a dozen ticks per contract on this trade.  Each tick is worth $31.25.

Charts Courtesy of MultiCharts built on an AMP platform.

ZB

YM

Bias

Yesterday we gave the markets an Upside bias and the markets didn't disappoint.  The Dow leaped  548 points and the other indices gained ground as well.  Today we aren't dealing with a correlated market and our bias is Neutral.

Could this change? Of Course.  Remember anything can happen in a volatile market. 

Commentary

We're starting to see a pattern that we haven't seen in a while whereby one day the market retreats and then the next day the markets advance dramatically.  As traders we need to be careful when the market does this as it could lead us into a false sense of expectation.  Expectation that may or may not be realized.  From our perspective we will do what we do each and every day and that is to use our rules of market correlation to determine direction.

Trading performance displayed herein is hypothetical. The following Commodity Futures Trading Commission (CFTC) disclaimer should be noted.

Hypothetical performance results have many inherent limitations, some of which are described below. No representation is being made that any account will or is likely to achieve profits or losses similar to those shown.

In fact, there are frequently sharp differences between hypothetical performance results and the actual results subsequently achieved by any particular trading program. One of the limitations of hypothetical performance trading results is that they are generally prepared with the benefit of hindsight.

In addition, hypothetical trading does not involve financial risk, and no hypothetical trading record can completely account for the impact of financial risk in actual trading. For example, the ability to withstand losses or to adhere to a particular trading program in spite of trading losses are material points which can also adversely affect actual trading results.

There are numerous other factors related to the markets in general or to the implementation of any specific trading program which cannot be fully accounted for in the preparation of hypothetical performance results and all of which can adversely affect actual trading results.

Trading in the commodities markets involves substantial risk and YOU CAN LOSE A LOT OF MONEY, and thus is not appropriate for everyone. You should carefully consider your financial condition before trading in these markets, and only risk capital should be used.

In addition, these markets are often liquid, making it difficult to execute orders at desired prices. Also, during periods of extreme volatility, trading in these markets may be halted due to so-called “circuit breakers” put in place by the CME to alleviate such volatility. In the event of a trading halt, it may be difficult or impossible to exit a losing position.

Recommended Content


Recommended Content

Editors’ Picks

EUR/USD clings to daily gains above 1.0650

EUR/USD clings to daily gains above 1.0650

EUR/USD gained traction and turned positive on the day above 1.0650. The improvement seen in risk mood following the earlier flight to safety weighs on the US Dollar ahead of the weekend and helps the pair push higher.

EUR/USD News

GBP/USD recovers toward 1.2450 after UK Retail Sales data

GBP/USD recovers toward 1.2450 after UK Retail Sales data

GBP/USD reversed its direction and advanced to the 1.2450 area after touching a fresh multi-month low below 1.2400 in the Asian session. The positive shift seen in risk mood on easing fears over a deepening Iran-Israel conflict supports the pair.

GBP/USD News

Gold holds steady at around $2,380 following earlier spike

Gold holds steady at around $2,380 following earlier spike

Gold stabilized near $2,380 after spiking above $2,400 with the immediate reaction to reports of Israel striking Iran. Meanwhile, the pullback seen in the US Treasury bond yields helps XAU/USD hold its ground.

Gold News

Bitcoin Weekly Forecast: BTC post-halving rally could be partially priced in Premium

Bitcoin Weekly Forecast: BTC post-halving rally could be partially priced in

Bitcoin price shows no signs of directional bias while it holds above  $60,000. The fourth BTC halving is partially priced in, according to Deutsche Bank’s research. 

Read more

Week ahead – US GDP and BoJ decision on top of next week’s agenda

Week ahead – US GDP and BoJ decision on top of next week’s agenda

US GDP, core PCE and PMIs the next tests for the Dollar. Investors await BoJ for guidance about next rate hike. EU and UK PMIs, as well as Australian CPIs also on tap.

Read more

Majors

Cryptocurrencies

Signatures