Oil’s new triangle: How Russia, India and America redraw the energy map

The geopolitics of necessity
Oil has always been more than a commodity; it is a measure of power, leverage, and survival. In 2025, the global map of energy flows is being redrawn by three actors whose interests rarely align: Russia, India, and the United States.
Russia needs cash to sustain its fiscal balance and war budget. India needs affordable energy to keep its growth momentum alive. And the United States, simultaneously the world’s top producer and the self-appointed regulator of energy flows, needs to contain inflation without losing geopolitical control.
The result is a fragile equilibrium built on pragmatism rather than policy — a triangle of necessity that defines the post-OPEC era. Each side trades with the others while pretending not to; each needs the other’s dysfunction to keep markets liquid. Oil is no longer about alliances, it’s about survival economics.
India’s pivot: Pragmatism over politics
Reports circulated last week that some Indian refiners may reduce Russian crude purchases by year-end following pressure from Washington and renewed insurance restrictions on “dark fleet” tankers. But for now, those are market whispers, not official policy. New Delhi has issued no statement confirming any halt, and senior officials have dismissed claims of a government-mandated reduction.
India currently imports between 1.3 and 1.5 million barrels per day of Russian oil, roughly one-third of its total intake. That stream has transformed India into a global refining hub: cheap Urals crude is processed in Jamnagar and Vadinar, then re-exported as diesel and jet fuel, often to the very Western markets enforcing sanctions. With Russian barrels trading at a $7–$9 discount to Brent, those margins remain too lucrative to abandon.
Even if state-owned refiners scale back for optics, private firms such as Reliance and Nayara are likely to sustain imports as long as the spread persists. India’s position is clear: buy low, refine smart, export high. That pragmatism has turned Delhi into a price-maker, monetizing geopolitical friction while walking a fine diplomatic line between Washington and Moscow.
The American paradox
For Washington, the situation borders on contradiction. The U.S. pumps over 13.4 million barrels per day, the highest output in history, yet still relies on imported blends to balance its refining system. Trying to sanction Russian oil without disrupting global supply requires surgical diplomacy — a task complicated by election-year politics and retail gasoline hovering above $3.50 per gallon.
To prevent price spikes, the White House has quietly encouraged Gulf allies to lift production, released additional barrels from the Strategic Petroleum Reserve, and lobbied India to diversify its sources. But this containment strategy risks backfiring. By pushing Russia out of Western markets, Washington has effectively cemented Moscow’s pivot to Asia — precisely the realignment it sought to avoid. If India truly cuts back, those barrels will simply flow to China at deeper discounts, reinforcing a parallel energy bloc.
America’s policy dilemma is stark: stabilize prices at home or isolate Russia abroad — it can’t fully achieve both.
Russia’s quiet endurance
Despite unprecedented sanctions, Russia remains the world’s second-largest oil exporter, shipping around 7.0 million barrels per day of crude and refined products. Roughly 60% now heads to Asia, where refiners have adapted to sanctions by creating bespoke financial and logistical networks.
The Kremlin has built a shadow fleet exceeding 600 tankers, many operating under secondary flags and opaque ownership structures. Transactions increasingly settle in rupees, yuan, and dirhams, bypassing Western finance entirely. In ruble terms, oil revenues have stabilized since mid-2024, cushioning fiscal losses from discounts.
For Moscow, every barrel sold — even at 70% of Brent’s price — funds domestic spending and geopolitical resilience. Its long-term objective is simple: outlast sanctions until enforcement fatigue sets in. As long as India and China keep buying, that strategy works.
Renko tells the story: Structure within decline
On the Renko WTI (XTIUSD) chart, structure and sentiment converge. The price has slipped toward $57.20, revisiting the same zone seen in late April. The sequence of consecutive red bricks signals sustained downside momentum, yet with a constructive undertone: volatility has narrowed, and bricks form orderly steps rather than panic drops.
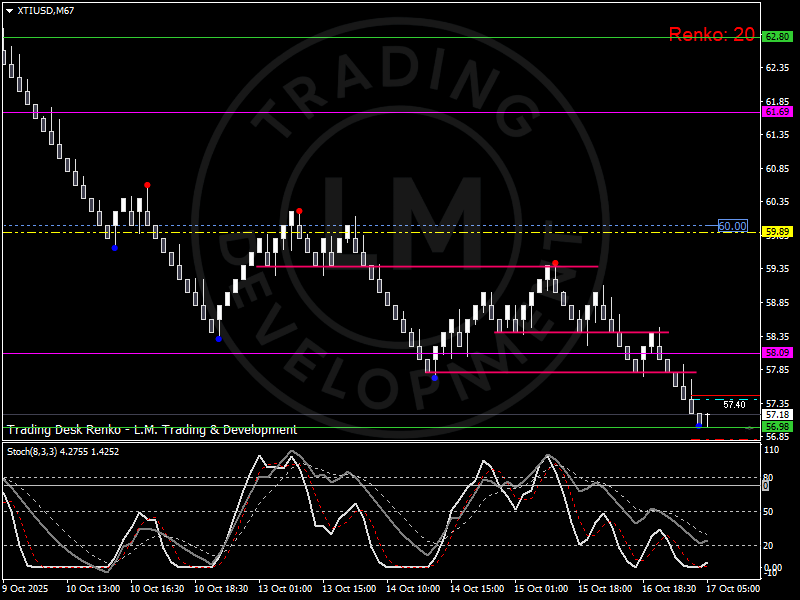
WTI (XTIUSD) Renko – controlled decline toward $57.00, support at $56.80, resistance near $59.80.
Support emerges near $56.80, a key level where buyers previously defended the spring lows. Above, initial resistance aligns at $57.80, then $59.80, coinciding with the mid-October consolidation band. The stochastic oscillator remains oversold but begins to flatten, suggesting that the latest leg lower may be losing force.
Technically, as long as the Renko sequence fails to print three consecutive higher-low red bricks below $56.80, the structure can still stage a rebound toward the $59.00–$60.00 zone. A confirmed break under $56.50, however, would shift the focus to $54.80, the psychological floor from early Q2.
Global spillovers and market psychology
Beyond the chart, oil’s behavior mirrors global fatigue. Investors are caught between conflicting narratives: macro slowdown versus geopolitical tension. Supply remains tight, yet demand signals are inconsistent — strong air travel, weak manufacturing, steady U.S. consumption.
Every headline from Delhi or Washington now triggers algorithmic reactions across energy futures and currency markets. WTI’s correlation with the dollar index has weakened, while its link to risk sentiment — particularly emerging-market equities — has strengthened. That reflects oil’s new identity: less an inflation hedge, more a sentiment gauge.
Meanwhile, the divergence between physical and paper barrels widens. Physical differentials (Urals-Brent, WTI-Dubai) show stress points that futures pricing can’t fully capture. In short, oil has become a proxy for trust — in data, in policy, in alliances.
Scenarios and the road ahead
Three paths define the next quarter:
- Status quo: India maintains steady Russian intake, U.S. rhetoric continues, WTI stabilizes near $58.00 — a base case of uneasy balance.
- Geopolitical escalation: new sanctions or shipping disruptions push prices back toward $62.00–$63.00 as supply risk premiums return.
- Demand shock: if global growth slows and India’s imports genuinely drop, WTI could retest $54.00–$55.00, revisiting the April trough.
In each scenario, the Russia–India–America triangle remains the axis of price discovery. What changes is not the direction of oil but the perception of who controls it.
Personal take: The politics of function
The energy map of 2025 reveals an uncomfortable truth — the world no longer runs on alliances, but on functional dependencies. Russia sells because it must, India buys because it can, and America mediates because it fears what happens if it doesn’t. This triangle is not a temporary workaround; it’s the new geometry of global oil.
Until prices rebuild structure above $60.00, sentiment will keep swinging between strategic caution and opportunistic buying. On the Renko chart, that rhythm is crystal clear — brick by brick, necessity still drives direction more than conviction.
Author

Luca Mattei
LM Trading & Development
Luca Mattei is a market analyst focusing on FX, metals, and macroeconomic trends. He develops trading tools for retail and professional traders, coding indicators and EAs for MT4/MT5 and strategies in Pine Script for TradingView.


