Oil prices on the retreat

Oil prices drop as Middle East market worries ease
Oil prices dropped in today’s opening as US and Iran halted their airstrikes over the past three days. Hopes for diplomatic efforts in Oman to work out a solution were raised, easing market worries for the supply side of the international oil market, weighing on the commodity’s prices. There are still substantial thorns, like the control of the Straits of Hormuz and Iran’s nuclear program, while the Houthis remain active in the Red sea. Nevertheless, further easing of the oil market’s worries could cause oil prices to drop even lower.
USD on the retreat in the FX market
The drop of oil prices and the enhancement of market hopes for diplomacy to work between the US and Iran hit the greenback possibly on two levels. The easing of market worries may have eased also safe haven inflows for the greenback. Furthermore and given the Fed’s interest rate decision on Wednesday, the drop of oil prices eased market worries for US inflation to accelerate.
US equity markets react positively to Middle East developments
US equities reacted positively to the drop of oil prices, and the easing of market worries for the US-Iran conflict. The market focus may be placed on the Fed’s interest rate decision on Wednesday. Also, the earnings season is in full swing, with high-profile mega-cap tech companies releasing their reports like Microsoft, Meta Platforms on Wednesday, while Apple and Amazon are expected on Thursday.
Other highlights for today
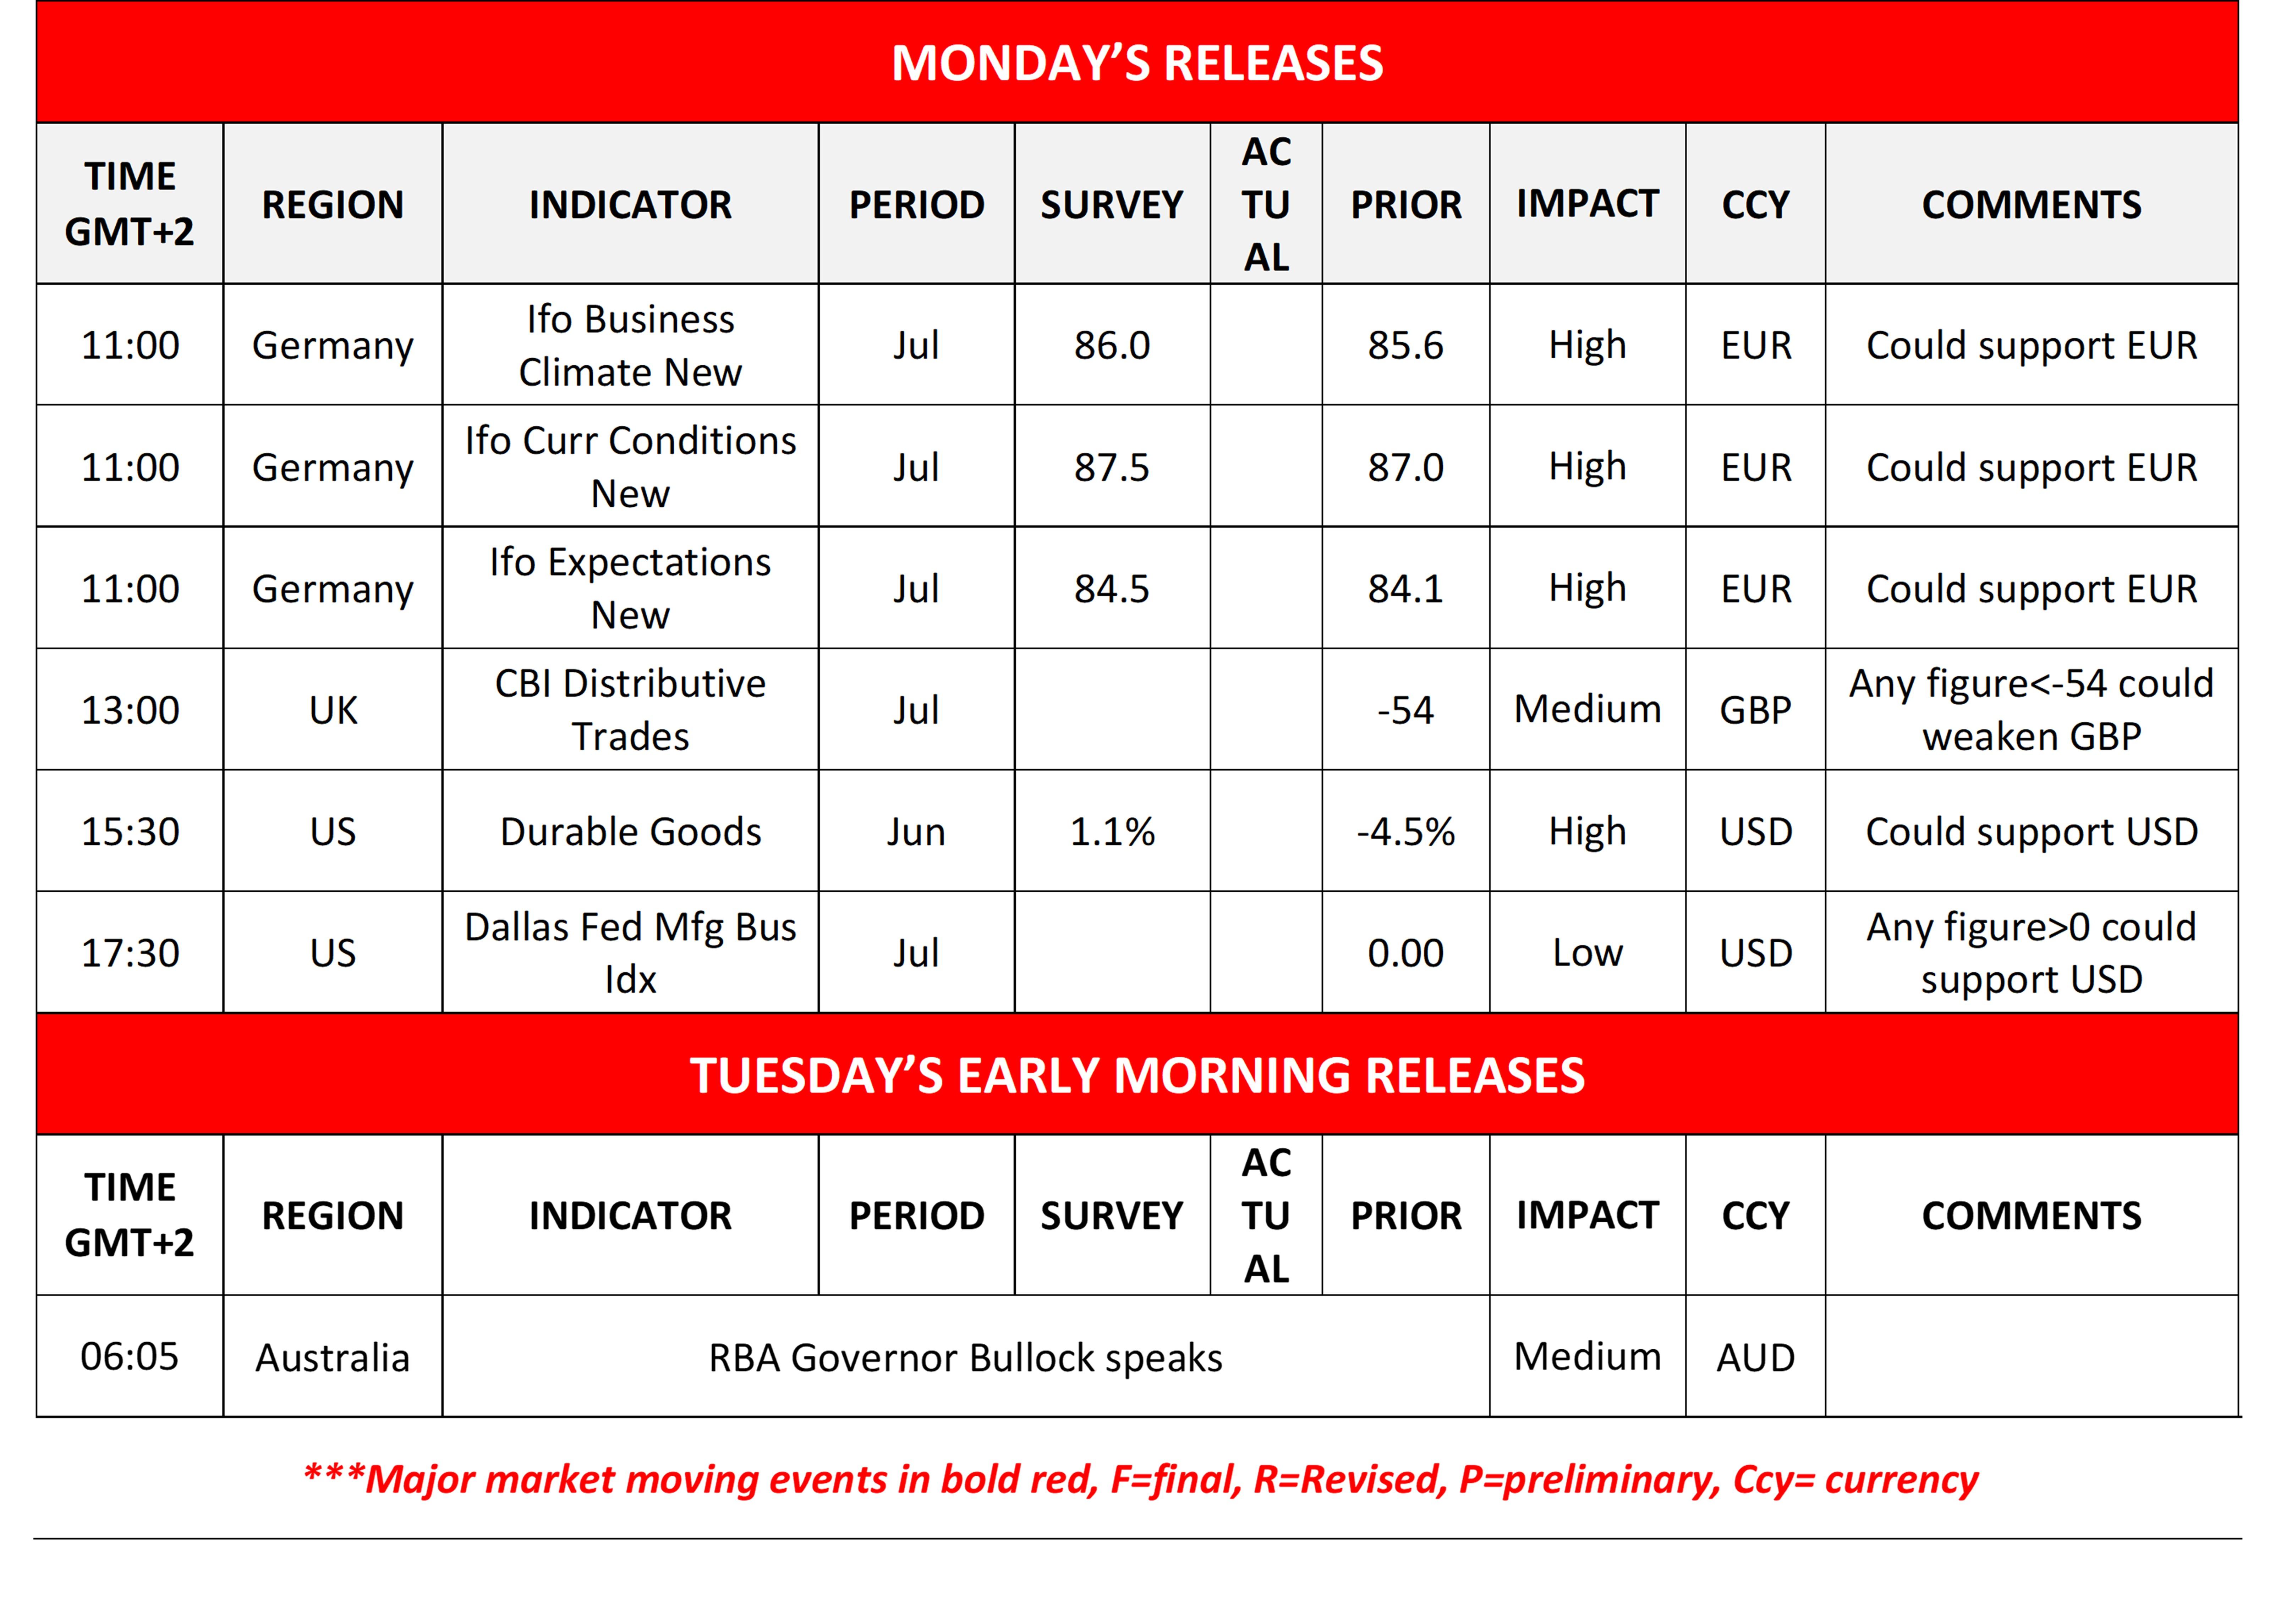
Today we get Germany’s Ifo indicators for July, the UK distributive trades also for July, the US durable goods orders for June.
As for the rest of the week
On Tuesday we get the US consumer confidence for July and on Wednesday we get Australia’s CPI rates of Q2, Sweden’s preliminary GDP rates for Q2, and the we highlight the Fed’s interest rate decision. On Thursday we get France’s, Germany’s, the Euro Zone’s and the Czech Republic’s preliminary GDP rates for Q2, Switzerland’s KOF indicator for July, UK’s BoE interest rate decision, Germany’s preliminary HICP rates for July, the US PCE rates for June, the GDP advance rates for Q2 and the weekly initial jobless claims. On Friday we get from Japan Tokyo’s CPI rates for July and the industrial output for June, China’s NBS manufacturing PMI figure for July, BoJ’s interest rate decision, UK’s nationwide house prices for July, Frances’ and the Euro Zone’s preliminary HICP rates for July, Canada’s GDP rates for May and the US final consumer sentiment for July.
Charts to keep an eye out
EUR/USD remained in a sideways motion between the 1.1470 (R1) resistance line and the 1.1350 (S1) support level. We expect the sideways movement to continue between the R2 and the S1 currently, given also the narrowing of the Bollinger bands. The RSI indicator, remains between the 30 and 50, implying a bearish predisposition for the pair but nothing convincing currently. Should the bears take over, EUR/USD may break the 1.1350 (S1) support line and aim for the 1.1210 (S2) support level. Should the bulls get in charge, we may see EUR/USD breaking the 1.1470 (R1) resistance level and aim for the 1.1575 (R2) base.
WTI’s price tumbled in today’s opening, breaking the 88.60 (R1) support line, now turned to resistance and is now teasing the 82.00 (S1) support line. Given that the drop of WTI’s price broke the upward trendline guiding it, we switch Friday’s bullish outlook for a sideways motion bias, yet warn for any bearish tendencies. Should the bears take over, WTI may break the 82.00 (S1) support line, and continue lower aiming for the 76.60 (S2) support level. Should the bulls regain control, WTI may break the 88.60 (R1) resistance line and start aiming for the 93.30 (R2) resistance level.
Calendar follows
EUR/USD daily chart
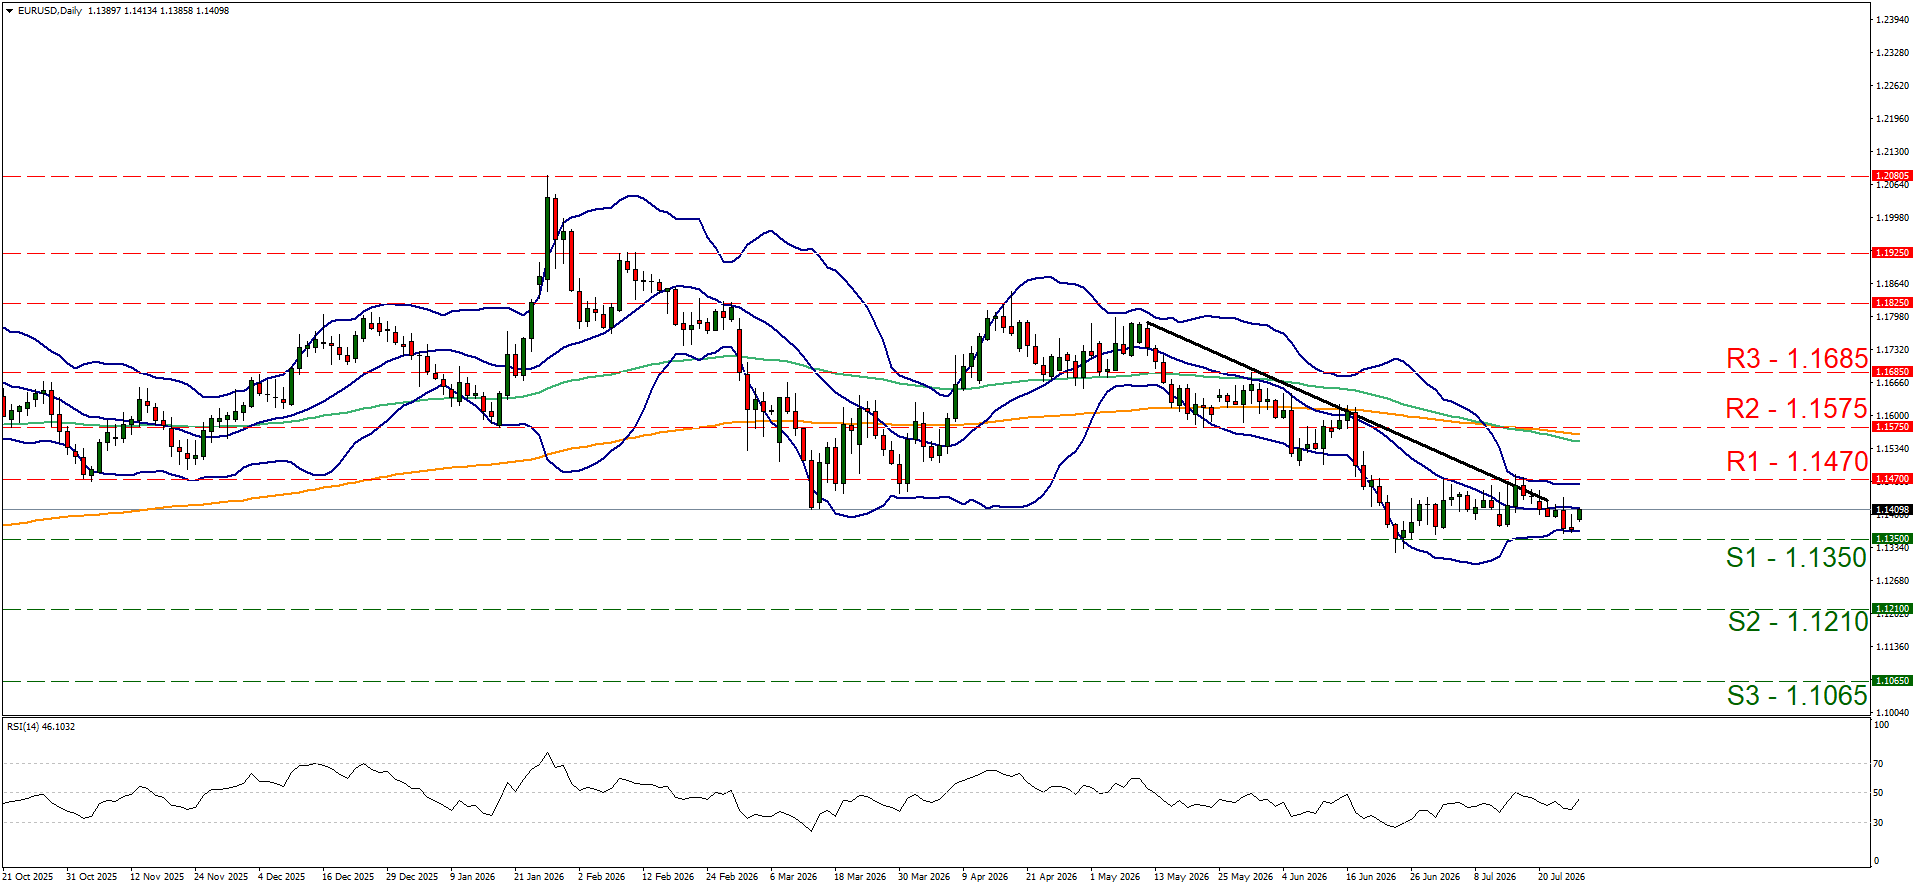
- Support: 1.1350 (S1), 1.1210 (S2), 1.1065 (S3).
- Resistance: 1.1470 (R1), 1.1575 (R2), 1.1685 (R3).
WTI daily chart
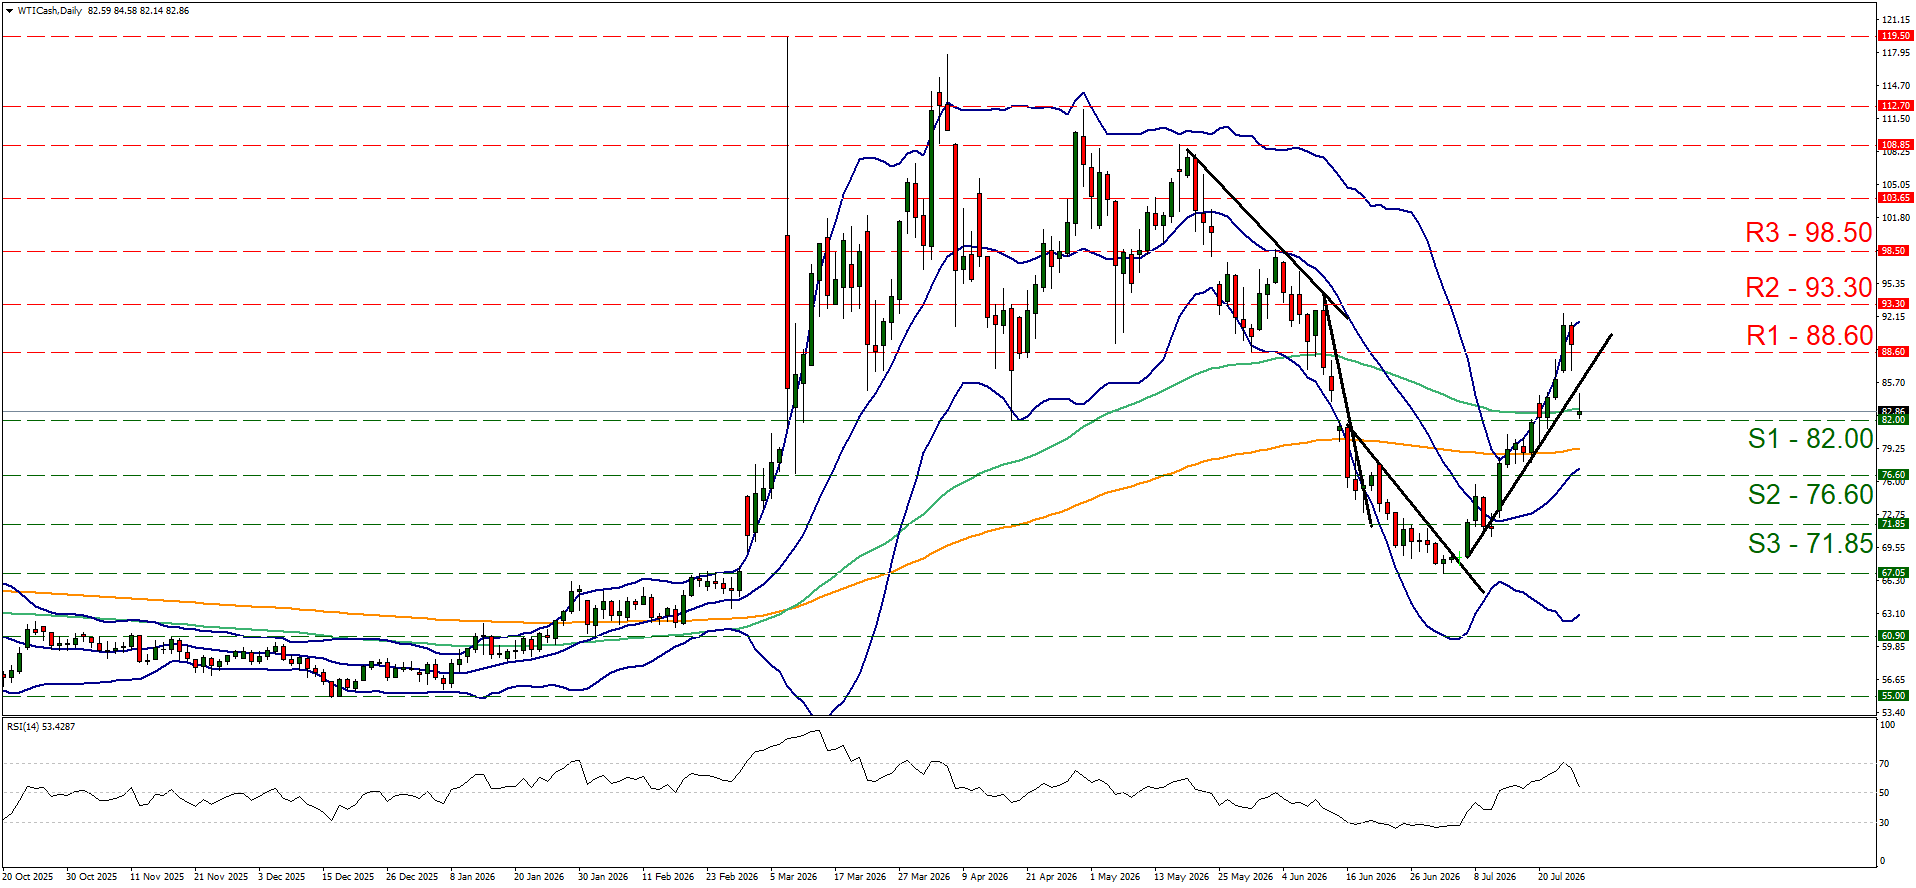
- Support: 82.00 (S1), 76.60 (S2), 71.85 (S3).
- Resistance: 88.60 (R1), 93.30 (R2), 98.50 (R3).
Author

Peter Iosif, ACA, MBA
IronFX
Mr. Iosif joined IronFX in 2017 as part of the sales force. His high level of competence and expertise enabled him to climb up the company ladder quickly and move to the IronFX Strategy team as a Research Analyst. Mr.

















