Oil outlook: US escalates tensions with Venezuela

WTI’s price appears to have moved lower since last week. In today’s report, we are to have a look at fundamental issues that could alter its direction, including the US’s seizure of a Venezuelan oil tanker, the peace plan for the war in Ukraine, and China’s technological developments in oil fracking. We are to conclude the report with a technical analysis of WTI’s daily chart.
US seizes a Venezuelan Oil tanker
The US in an apparent escalation of tensions against Venezuela, seized a sanctioned oil tanker of the coast of Venezuela. Per President Trump “We've just seized a tanker on the coast of Venezuela, large tanker, very large, largest one ever, actually, and other things are happening”, with Venezuela responding that the seizure was an “act of international piracy”. The seizing of a Venezuelan oil tanker, even a sanctioned one still marks an escalation in tensions between Washington and Caracas, considering Venezuela’s oil exports are essentially their economic lifeline. In this analyst’s opinion, the US may be wary of replacing Maduro with the use of direct military force such as troops on the ground and thus a more political friendly method could be by the exertion of economic pressures. For example, should the US continue to disrupt Venezuela’s oil shipments it may increase pressure internally for a change to be made, which could pave the way forward for the ‘installation’ of a more pro-western President in the nation. Initially, the seizure of an oil tanker may have aided oil prices as worries about further seizures may have spooked participants, considering Venezuela exports 900,000 bpd and thus further seizures could threaten the supply of oil into the market. However, let’s look at the larger picture and the hypothetical scenario where the US continues pulling the economic lever to force a regime change in Venezuela. Such a scenario, where a pro-US administration is installed, could weigh on oil prices, as sanctions may be lifted on Venezuelan oil exports which in turn could rapidly increase the supply of oil into the global market. Nonetheless, we should remind our readers that at this point in time, such a scenario remains a hypothetical.
Ukraine-Russia peace deal
Ukraine and Russia could be heading towards a possible peace deal. According President Zelensky, Ukraine alongside its European allies will be presenting the US with refined documents on a peace plan meant to end the war with Russia. Specifically, Zelensky stated the following “The Ukrainian and European components are now more developed, and we are ready to present them to our partners in the U.S.,”. Considering how many attempts have been made by both sides, we remain skeptical as to whether or not actual progress will be made in ending the war. Nonetheless, any viable prospects for peace could weigh on oil prices, as an end to the war could result in the suspension of sanctions on Russian oil exports, thus potentially resulting in an influx of oil barrels entering the market.
China’s shale fracking
According to some media reports, China has achieved significant breakthroughs in it’s shale fracking technology following the announcement that the Jimsar shale oil demonstration zone in Xinjiang has reached its annual crude oil output goal of 1.7 million tonnes. Although this may appear to be a significant development, it’s short term impact may be relatively muted as the volume itself may not be large enough to influence the global oil markets. Nevertheless, the developments may have a long term impact on oil prices in the future should they reach much higher output volumes which in turn could weigh on oil prices in the future and thus developments of China’s fracking technology warrant attention from market participants.
Technical analysis
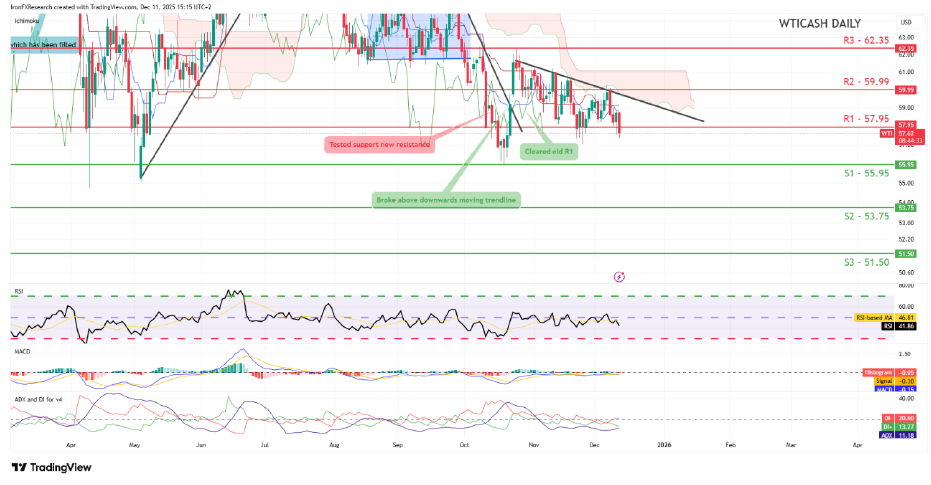
- Support: 55.95 (S1), 53.75 (S2), 51.50 (S3).
- Resistance: 57.95 (R1), 59.99 (R2), 62.35 (R3).
WTI’s price action appears to be moving in a downwards fashion, having currently penetrated our support now turned to resistance at the 57.95 (R1) level. We maintain our bearish outlook for the commodity and supporting our case is the downwards moving trendline which was incepted on the 24th of October, in addition to the indicators below our chart which tend to imply a bearish market sentiment. For our bearish outlook to be maintained we would require WTICash’s price to remain below our R1 level if not also clearing our 55.95 (S1) support level, with the next possible target for the bears being our 53.75 (S2) support line. On the other hand, for a bullish outlook we would require a clear break above our 57.95 (R1) resistance line if not also our 59.99 (R2) resistance level with the next possible target for the bulls being our 62.35 (R3) resistance line. Lastly, for a sideways bias we would require the commodity’s price to remain between our 55.95 (S1) support level and our 57.95 (R1) resistance line.
Author

Phaedros Pantelides
Independent Analyst
Mr Pantelides has graduated from the University of Reading with a degree in BSc Business Economics, where he discovered his passion for trading and analyzing global geopolitics.


