Oil outlook: Israel-Hezbollah tensions to ease?

Oil prices appear to have remained relatively unchanged compared to last week. Today we are to take a look at the recent easing of hostilities between Israel and Hezbollah, the data of the US oil market and OPEC’s next meeting. For a rounder view, we are to conclude the report with a technical analysis of WTI’s daily chart.
Israel-Hezbollah tensions to ease
On a geopolitical level, the Israeli Government has agreed in principle, to a ceasefire agreement with Hezbollah in Lebanon, with Israel’s Cabinet having accepted the proposed ceasefire agreement earlier on this week. The proposed ceasefire deal would temporarily end hostilities between the Israeli army and Hezbollah with an initial truce period of 60 days, with Israeli forces withdrawn from Lebanon, and in exchange, Hezbollah would end its presence south of the Litani River and would be replaced by Lebanese Army troops per the BBC. In our view, we would not be surprised to see the ceasefire proposal being respected relatively by both sides at least for now.. Moreover, with the situation still volatile, the peace process could easily be upended and until the official confirmation with signatures from both sides, we would not take any ceasfire for granted. Nonetheless, in the event of the ceasefire holding up, we may see geopolitical tensions temporarily easing in the region which may weigh on the liquid gold’s price. Yet should the peace process be upended, we may see renewed tensions in the region potentially pushing oil prices higher. In our view, we would not be surprised to see the ceasefire agreement being met with some hiccups but eventually leading a more substantial peace agreement. Yet, what is most concerning are the recent escalations in Syria between the Rebel groups and the Assad regime, which have increased over the past few days and should that also involve the Kurdish forces which control Syria’s northern oil fields then we may see an impact on the oil markets.
Uptick in the US Oil market
We make a start with the data on the ground of the US oil market by noting that the Baker Hughes US oil rig count showed that the number of active US oil rigs increased by one, reaching 479. Last week’s increase is immaterial as such, yet the number has ended a 5-week decreasing streak, which may imply a tendency that demand for oil in the US may be beginning to increase, which in turn may support oil prices. The aforementioned theory was further supported by Tuesday API figures which reported a substantial drawdown of US oil inventories of –5.935 million barrels a figure, vastly eclipsing last week’s oil inventories increase of 4.753 million barrels. It should also be noted that yesterday EIA also reported a drawdown of 1.844 million barrels, further supporting our hypothesis that demand for oil in the US market increased. Nonetheless, should oil demand in the US continue to rise in the upcoming week, we may see some support for oil prices.
OPEC+ meeting set on the 5th of December
OPEC+ per CNBC has postponed a meeting in which the oil cartel members were set to discuss the group’s next steps in regards to their oil production levels. The meeting was set to occur on the 1st of December but has been pushed back to December 5th according to CNBC’s sources. Nonetheless, next week may see increased volatility in the oil markets, as market participants await to see as to whether or not OPEC+ will extend its 2.2 million bpd voluntary oil production cuts. Thus, should OPEC+ extend or go beyond its voluntary oil production cuts it current has in place, it may oil prices. Whereas, should they be scrapped, it could instead weigh on oil prices.
Technical analysis
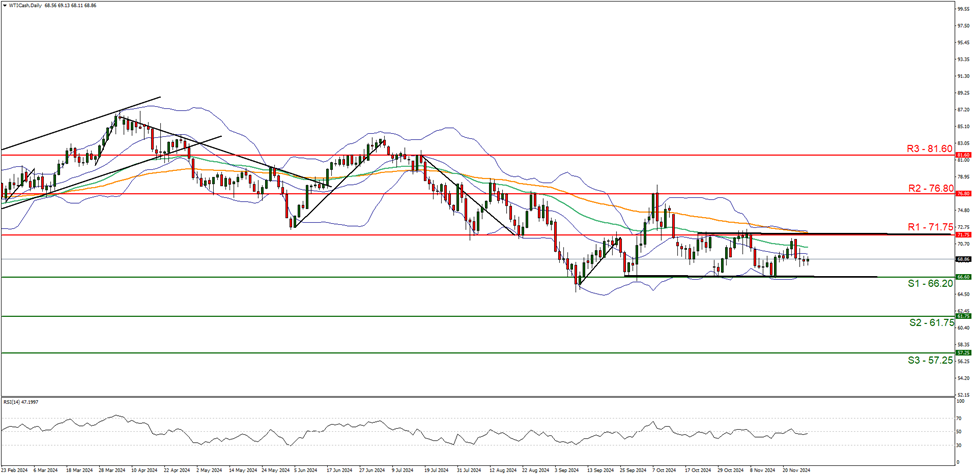
WTI cash daily chart
-
Support: 66.20 (S1), 61.75 (S2), 57.25 (S3).
-
Resistance: 71.75 (R1), 76.80 (R2), 81.60 (R3).
WTI appears to be continuing on its sideways path, remaining confined between the 66.20 (S1) support level and the 71.75 (R1) resistance line. We opt for a sideways bias for the commodity’s price and supporting our case is the RSI indicator our chart which currently registers a figure near 50, implying a neutral market sentiment, in addition to the sideways moving channel which was incepted on the 26th of September. For our sideways bias to continue, we would require the commodity’s price to remain confined between the 66.20 (S1) support level and the 71.75 (R1) resistance line. On the flip side for a bullish outlook, we would require a clear break above the 71.75 (R1) resistance line, with the next possible target for the bulls being the 76.80 (R2) resistance level. Lastly, for a bearish outlook we would require a clear break below the 66.20 (S1) support level, with the next possible target for the bears being the 61.75 (S2) support base.
Author

Phaedros Pantelides
Independent Analyst
Mr Pantelides has graduated from the University of Reading with a degree in BSc Business Economics, where he discovered his passion for trading and analyzing global geopolitics.


