|

Oil (CL) should see at least three waves rally soon [Video]

Cycle from 9.28.2023 high in Oil (CL) is in progress as a 5 waves impulse Elliott Wave structure. Down from 9.28.2023 high, wave 1 ended at 81.50 and rally in wave 2 ended at 90.78. Oil then extended lower in wave 3 towards 72.16. Wave 4 at 79.55 as the 1 hour chart below shows. Up from wave 3, wave ((a)) ended at 78.22, and dips in wave ((b)) ended at 73.79. Wave ((c)) higher ended at 79.55 which completed wave 4. Up from wave ((b)), wave (i) ended at 77.15 and wave (ii) ended at 74.06. Wave (iii) ended at 79.6, wave (iv) ended at 77.91, and wave (v) ended at 79.55 which completed wave ((c)) of 4.

Oil Futures (CL_F) 60 minutes Elliott Wave chart

Chart

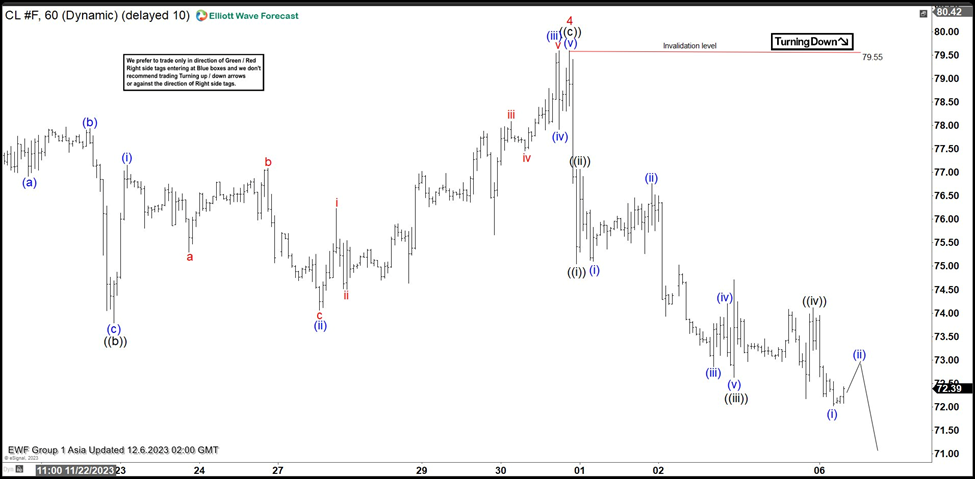
Oil has turned lower in wave 5. Internal subdivision of wave 5 is unfolding as a 5 waves impulse structure. Down from wave 4, wave ((i)) ended at 75.05 and wave ((ii)) rally ended at 77.07. Oil then turns lower in wave ((iii)). Down from wave ((ii)), wave (i) ended at 75.1 and rally in wave (ii) ended at 76.76. Oil extends lower in wave (iii) towards 72.86, wave (iv) ended at 74.20, and final leg wave (v) ended at 72.63 which completed wave ((iii)). Wave ((iv)) correction ended at 74.12. Expect Oil to extend lower in wave ((v)) of 5. Near term, as far as pivot at 79.55 stays intact, Oil has scope to extend a bit lower to end the 5 waves move before larger 3 waves rally takes place.

CL Elliott Wave video

Author

Elliott Wave Forecast Team

Elliott Wave Forecast Team

ElliottWave-Forecast.com

More from Elliott Wave Forecast Team
Share:

Markets move fast. We move first.

Orange Juice Newsletter brings you expert driven insights - not headlines. Every day on your inbox.

By subscribing you agree to our Terms and conditions.

Editor's Picks

EUR/USD: Bulls pray for a dovish Fed

EUR/USD has finally taken a breather after a pretty energetic climb. The pair broke above 1.1680 in the second half of the week, reaching its highest levels in around two months before running into some selling pressure. Even so, it has gained almost two cents from the late-November dip just below 1.1500 the figure.

GBP/USD trims gains, recedes toward 1.3320

GBP/USD is struggling to keep its daily advance, coming under fresh pressure and retreating to the 1.3320 zone following a mild bullish attempt in the Greenback. Even though US consumer sentiment surprised to the upside, the US Dollar isn’t getting much love, as traders are far more interested in what the Fed will say next week.

Gold: Bullish momentum fades despite broad USD weakness

After rising more than 3.5% in the previous week, Gold has entered a consolidation phase and fluctuated at around $4,200. The Federal Reserve’s interest rate decision and revised Summary of Economic Projections, also known as the dot plot, could trigger the next directional move in XAU/USD. 

Week ahead: Rate cut or market shock? The Fed decides

Fed rate cut widely expected; dot plot and overall meeting rhetoric also matter. Risk appetite is supported by Fed rate cut expectations; cryptos show signs of life. RBA, BoC and SNB also meet; chances of surprises are relatively low. Dollar weakness could linger; both the aussie and the yen best positioned to gain further. Gold and oil eye Ukraine-Russia developments; a peace deal remains elusive.

Week ahead – Rate cut or market shock? The Fed decides

Fed rate cut widely expected; dot plot and overall meeting rhetoric also matter. Risk appetite is supported by Fed rate cut expectations; cryptos show signs of life. RBA, BoC and SNB also meet; chances of surprises are relatively low.

Ripple faces persistent bear risks, shrugging off ETF inflows

Ripple is extending its decline for the second consecutive day, trading at $2.06 at the time of writing on Friday. Sentiment surrounding the cross-border remittance token continues to lag despite steady inflows into XRP spot ETFs.