Oil at $120, Elliott Waves, and global crash risk: Weekly market analysis [Video]
![Oil at $120, Elliott Waves, and global crash risk: Weekly market analysis [Video]](https://editorial.fxsstatic.com/images/i/West-Texas-Intermediate_3.png)
Oil surging from $90 to $120 a barrel, negative U.S. macro data, a strengthening dollar, and rising geopolitical tensions in the Middle East. This is not a week for impulsive trading — it's a week for those who understand market structure and know how to read institutional liquidity.
In this weekly analysis, we'll walk through how to interpret a high-volatility environment using Elliott Wave theory, commercial positioning, and liquidity analysis. The goal is straightforward: to help you anticipate scenarios, protect your capital, and capitalize on moves that most market participants fail to understand.
We'll cover the impact of oil on inflation and the cost of capital, the role of commercials as the true "smart money," latent risks in the S&P 500 and Bitcoin, and key opportunities in EURUSD. With this framework, you can stop reacting emotionally to headlines and start trading with a plan aligned with institutional liquidity.
Oil as the catalyst: Inflation and the cost of capital
When oil prices spike from the $90 zone to $120 per barrel in a short period, this is far more than just another chart move. For any trader or investor, it represents direct inflationary pressure on the global economy. Oil is a fundamental input for transportation, manufacturing, and logistics — every additional dollar eventually filters through to final consumer prices.
This inflationary pressure has an immediate consequence: it makes it harder for the cost of capital to come down. The cost of capital is primarily reflected in bond interest rates. As long as expected inflation remains elevated, rates will tend to stay high, making financing more expensive, slowing investment, and reducing risk appetite across the board.
With high rates, credit tightens, companies struggle, and valuations compress. With declining rates, the incentive to take on risk in equities, indices, and other assets increases. Understanding this relationship gives you a clear edge — you stop viewing oil as just another ticker and start interpreting it as the "pressure gauge" that either fuels or drains liquidity from the financial system.
The role of commercials: The true smart money
In institutional analysis, commercials represent the participants who truly understand market structure: major producers, hedgers, and strong hands operating with a long-term perspective. They tend to be positioned correctly before major turning points.
When commercials are selling aggressively while retail traders buy euphoria-driven, you're witnessing a transfer of risk from smart money to weak hands. This behavior typically precedes deep correction phases, false breakouts that trap undisciplined traders, and zones where the market builds liquidity for a subsequent counter-move.
Monitoring the positioning curve of these participants allows you to assess whether the current move is healthy or merely a trap. If commercials are still not accumulating risk, the scenario for further downside in indices and risk assets remains on the table. This approach helps you avoid the common losses associated with "bargain buying" in the middle of bearish trends that haven't yet run their course.
S&P 500, equities, and Bitcoin: A fragile environment
With oil at extreme levels, weak employment data, rising unemployment, and stagnant retail sales, the environment for risk assets is precarious at best. The S&P 500, individual stocks, and cryptocurrencies like Bitcoin face a dual problem: less available liquidity for speculation and greater sensitivity to any additional negative news.
In this context, you don't need to predict the future. What you need is an adaptive approach: determine whether the index is making new lows or merely technical pullbacks, observe whether volume confirms the decline or shows divergences, and verify whether commercials are beginning to buy or continue reducing exposure.
Until we see a combination of oil stabilizing, the cost of capital declining, and commercials accumulating risk, any strong bounce could end up being nothing more than a relief rally within a larger bearish structure. This reading helps protect capital and avoid the "buy the dip" trap without institutional confirmation.
Bullish Dollar, bearish risk: Practical implications
The current setup shows a bullish dollar, while risk assets (indices, equities, crypto) remain fragile or bearish. This classic "strong dollar – weak risk" relationship tends to intensify during periods of fear, conflict, or geopolitical tension.
For active traders, this carries several practical implications. Long positions in equity indices require greater selectivity and tighter risk management. Currency pairs where the dollar serves as the base or reference currency may offer tactical opportunities aligned with dollar strength. And dollar-denominated assets may face additional selling pressure.
When you integrate this macro reading into your trading plan, you stop viewing each pair or asset in isolation. You begin working with a coherent global map that filters out low-probability trades and focuses on structures with genuine macro and institutional support.
EUR/USD analysis: Gap, Elliott Waves, and probable scenarios
EURUSD opened with a significant gap following the weekend, reflecting the immediate impact of Middle East news and the abrupt shift in risk appetite. From an Elliott Wave perspective, this price action can fit into two main scenarios: a developing bearish leg where the gap acts as trend acceleration, or an exhaustive move that sets the stage for a technical bounce later on.
When analyzing the structure, the focus should be on identifying whether price is completing a Wave 3 or a Wave C to the downside, looking for Fibonacci projection levels (such as 161.8% or 261.8%) as reasonable targets, and defining the point where a new low could complete the sequence, paving the way for a bounce or even a trend reversal.
With this method, the operational plan involves selling while the bearish pattern remains intact, with stops adjusted above key invalidation levels. Once price reaches an important target, fundamentals and liquidity are reassessed to determine whether it's time to consider longs or wait for a new pullback to continue selling. This discipline prevents impulsive action and maintains an objective, repeatable process.
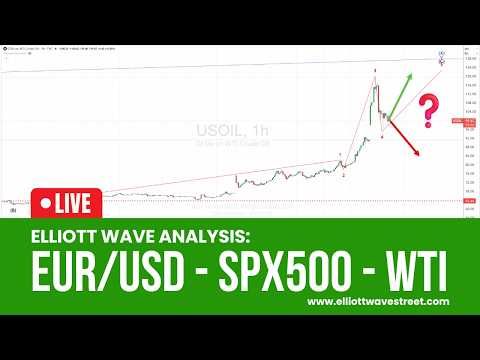
Oil manipulation and liquidity: How to avoid getting trapped
The volume distribution in oil's recent move suggests a pattern typical of institutional manipulation: a strong bullish impulse on thin real volume, leveraging alarming headlines to induce desperate buying at the open.
This pattern tends to follow a familiar script. Shocking news triggers fear and greed. Price spikes rapidly, generating FOMO. Retail traders buy late, near the highs. Strong hands use the opportunity to distribute and then let price fall.
By recognizing these dynamics, you can avoid getting trapped in impulsive purchases in poorly distributed volume zones. Observing volume profiles, price reactions, and the relationship between price and news provides concrete tools to trade with institutional liquidity rather than against it.
Risk management and psychology: Your best defense in extreme weeks
Weeks like this test psychology above all else. Overexposure to news, social media, and alarming headlines tempts traders to operate from fear or euphoria rather than a rational plan.
To protect your capital, it's essential to define maximum risk per trade and per day in advance, avoid increasing position size just because "this time it has to work," maintain a trading journal recording emotions, decisions, and outcomes, and accept that missing opportunities is always preferable to irreversibly losing capital.
With these simple guidelines, you can maintain mental clarity and stick to your methodology, even when the market feels completely out of control.
Structure, discipline, and institutional vision
This week presents a complex scenario: oil surging, negative macro data, crash risk, a strong dollar, and critical technical structures in pairs like EURUSD. However, complexity doesn't have to mean confusion.
By integrating Elliott Wave analysis, commercial positioning data, and an understanding of institutional liquidity, you can stop reacting to noise and start acting with precision and patience. The key lies in developing a written plan, reviewing daily whether your decisions align with liquidity and the macro context, and maintaining discipline as a foundational pillar.
With continuous education and a structured approach, high-volatility weeks become managed opportunities rather than threats to your account. At Elliott Wave Street, we continue to deepen these concepts through our live sessions and VolWaves AI analysis, so you have the tools you need to trade with confidence.
Author

Juan Maldonado
Elliott Wave Street
Juan Maldonado has a University degree in Finance, and Foreign trade started his trading career in 2008. Since 2010 has been analyzing the markets using Elliott Wave with different strategies to spot high probability trades.


