Oil and S&P500 both lower: A new correlation or something temporary?

US Dollar: Sept. USD is Up at 96.630.
Energies: Sept '18 Crude is Down at 66.40.
Financials: The Sept 30 year bond is Up 2 ticks and trading at 144.03.
Indices: The Sept S&P 500 emini ES contract is 15 ticks Lower and trading at 2837.50.
Gold: The Dec Gold contract is trading Down at 1195.50 Gold is 50 ticks Lower than its close.
Initial Conclusion
This is not a correlated market. The dollar is Up+ and Crude is Down- which is normal and the 30 year Bond is trading Higher. The Financials should always correlate with the US dollar such that if the dollar is lower then bonds should follow and vice-versa. The S&P is Lower and Crude is trading Lower which is not correlated. Gold is trading Down- which is correlated with the US dollar trading Higher. I tend to believe that Gold has an inverse relationship with the US Dollar as when the US Dollar is down, Gold tends to rise in value and vice-versa. Think of it as a seesaw, when one is up the other should be down. I point this out to you to make you aware that when we don't have a correlated market, it means something is wrong. As traders you need to be aware of this and proceed with your eyes wide open.
At this hour Asia is trading mainly Lower with the exception of the Indian Sensex exchange which is Higher at this time. Europe is trading mainly Higher at this time with the exception of the London and Milan exchanges which are Lower.
Possible Challenges To Traders Today
-
Core Retail Sales is out at 8:30 AM EST. This is major.
-
Retail Sales is out at 8:30 AM EST. This is major.
-
Empire State Mfg Index is out at 8:30 AM EST. This is major.
-
Prelim Nonfarm Productivity is out at 8:30 AM. This is major.
-
Prelim Unit Labor Costs is out at 8:30 AM EST. Major.
-
Capacity Utilization Rate is out at 9:15 AM EST. Major.
-
Industrial Production m/m is out at 9:15 AM EST. Major.
-
Business Inventories m/m is out at 10 AM EST. Not Major.
-
Mortgage Delinquencies. This is major.
-
NAHB Housing Market Index is out at 10 AM EST. Major.
-
Crude Oil Inventories is out at 10:30 AM EST. This is major.
-
TIC Long-Term Purchases is out at 4 PM. Not Major.
Treasuries
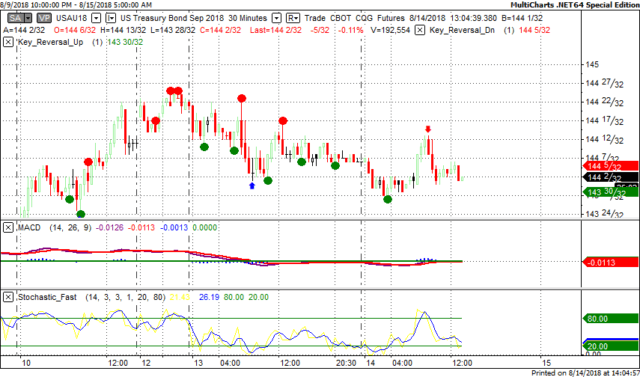
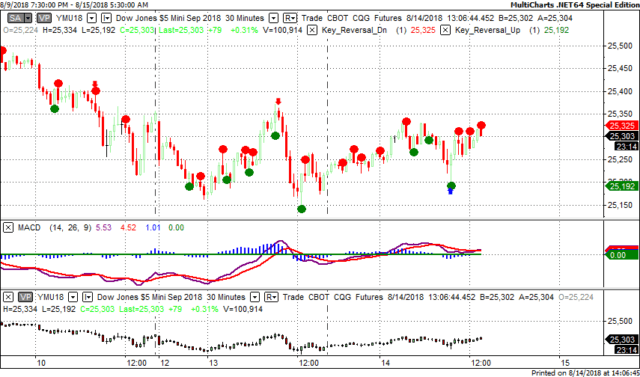
We've elected to switch gears a bit and show correlation between the 30 year bond (ZB) and The YM futures contract. The YM contract is the DJIA and the purpose is to show reverse correlation between the two instruments. Remember it's liken to a seesaw, when up goes up the other should go down and vice versa.
Yesterday the ZB made it's move at around 9 AM EST. The ZB hit a High at around that time and the YM hit a Low. If you look at the charts below ZB gave a signal at around 9 AM EST and the YM was moving Higher at the same time. Look at the charts below and you'll see a pattern for both assets. ZB hit a High at around 9 AM and the YM was moving Higher at the same time. These charts represent the newest version of MultiCharts and I've changed the timeframe to a 30 minute chart to display better. This represented a shorting opportunity on the 30 year bond, as a trader you could have netted about 13 ticks per contract on this trade. Each tick is worth $31.25.
Charts Courtesy of MultiCharts built on an AMP platform.
Bias
Yesterday we gave the markets an Upside bias as the USD and the Bonds were both trading Lower Tuesday morning and this usually reflects an Upside bias. The markets didn't disappoint as the Dow gained 112 points and the other indices gained ground as well. Today we aren't dealing with a correlated market and our bias is Neutral.
Could this change? Of Course. Remember anything can happen in a volatile market.
Commentary
Yesterday we said that the markets need to get back to the business of business and it would appear as though they listened. This was the first trading in many in which the markets gained ground even though everyone was still talking about the "Turkish Tantrum". The Dow gained solidly as did the other indices as well. Today we have a virtual tsunami of economic reports: roughly 11 in all; so it only goes to show the feast or famine world of eco reports. Chief among them are Retail Sales, Core Retail Sales, NAHB Housing Market Index, Crude Oil Inventories and others....Can these move the markets? You bet....
Author

Nick Mastrandrea
Market Tea Leaves


