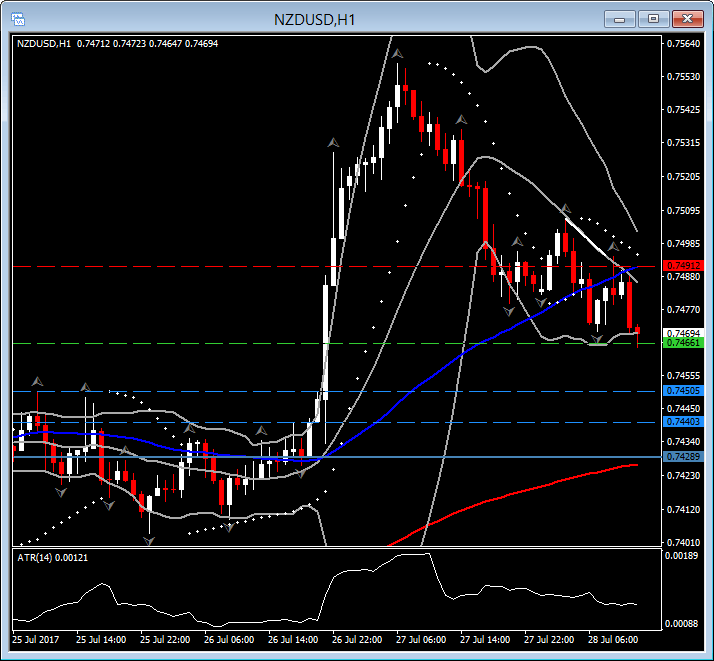
NZDUSD – hourly chart

NZDUSD, H1
NZDUSD setlled back today at 0.7460 low. A Short Intra-Day position was taken based on these hourly chart with entry at 0.74661, and targets at 0.7450 and 0.7440 ( 23.6 Fibonacci level as well). A breach and break of the recent fractal low at 0.7469 confirmed this intra-day entry along with the fact that pair after 0.7507 high today, it did not manage to break the 20-period MA and hence continue to moves in the lower Bollinger Bands area, by making Lower High fractals. Meanwhile 20-period MA currently moves below 50 period MA. This suggests hourly weakness for the pair. In 30-minutes chart, NZDUSD, hit earlier 61.8 Fibonacci level and retraced again lower. In both time frames Parabolic SAR turning negative.
Nevertheless, the US calendar today features a flood of data releases, highlighted by advance Q2 GDP figures and Personal Consumption Expenditures Prices , which will be a big focus for markets.
Author

Having completed her five-year-long studies in the UK, Andria Pichidi has been awarded a BSc in Mathematics and Physics from the University of Bath and a MSc degree in Mathematics, while she holds a postgraduate diploma (PGdip) in


