NZD/USD EMAs Move into Bearish Stack on Daily Timeframe

The below is the daily chart of the NZDUSD. The 5-day EMA crossed below the orange 10-day EMA (blue ellipse). This puts the EMAs into a bearish stack. I.e. the green 5-day EMA is below the orange 10-day EMA, and the orange 10-day EMA is below the black 34-day EMA. Moreover, the RSI has moved below 50, which suggests that the underlying momentum is bearish. If the EMAs develop further angle and separation lower prices are likely. We continue to monitor.
Past performance is not an indicator of future results.
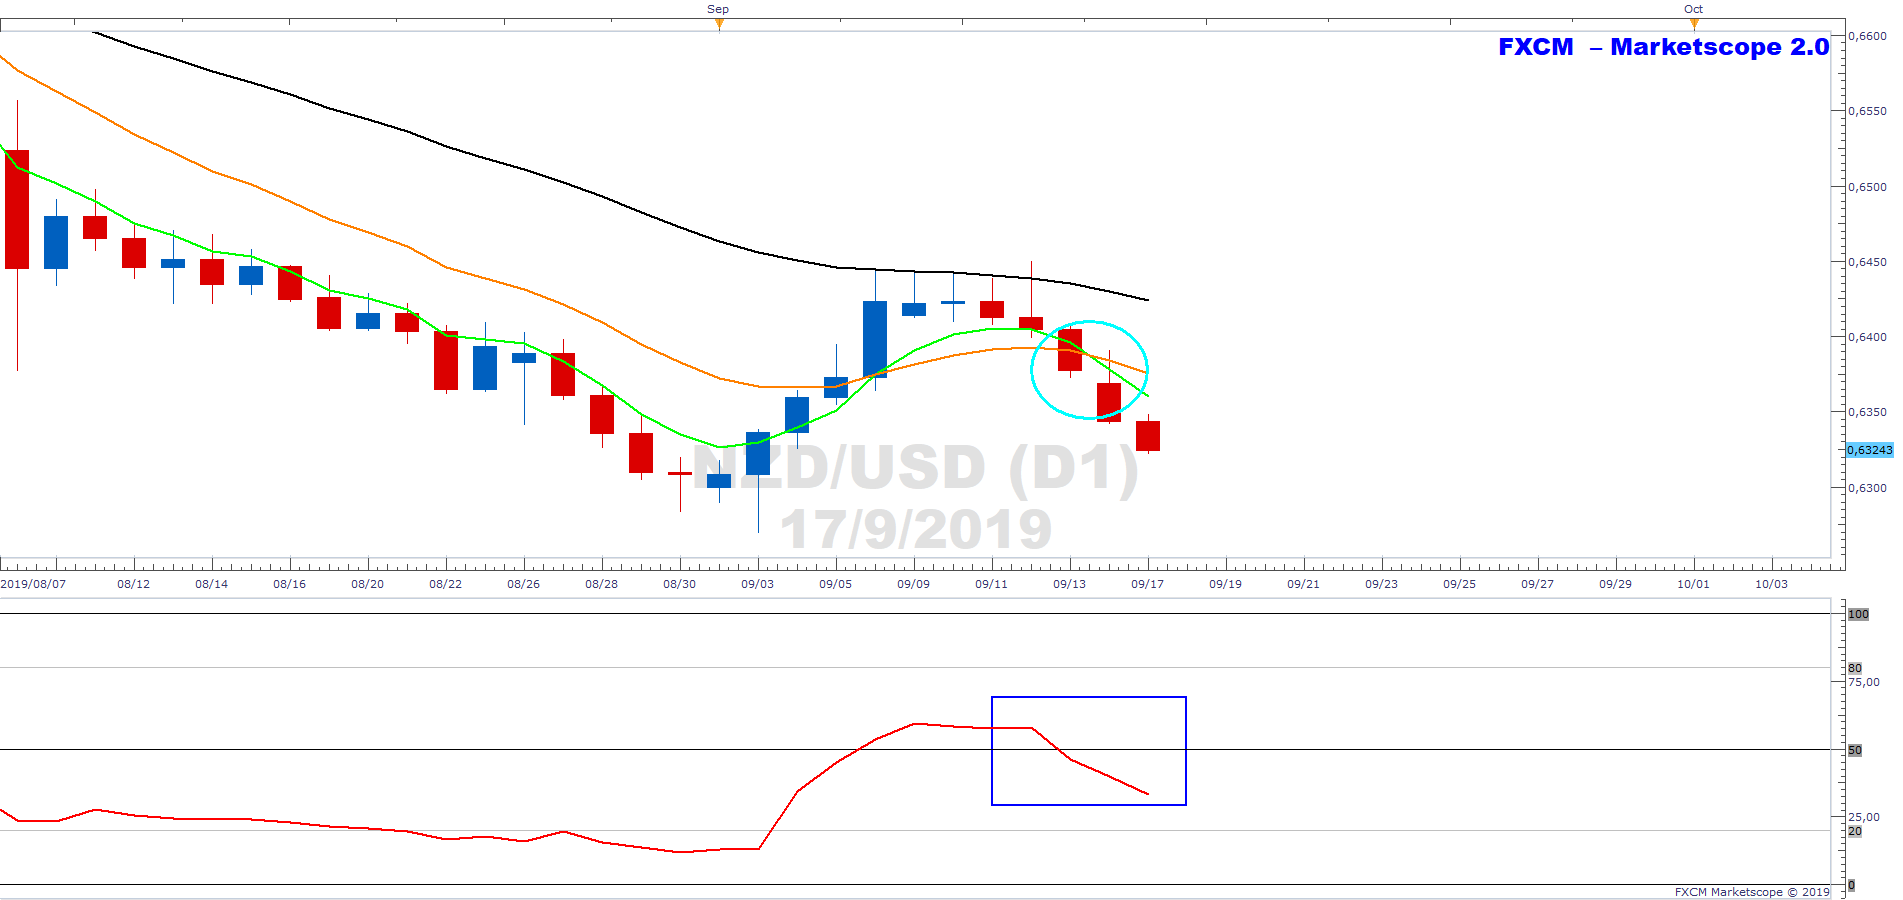
CHART SOURCE: FXCM MARKETSCOPE 2.0
Author

Russell Shor (MSTA, CFTe, MFTA) has an Honours Degree in Economics from the University of South Africa and holds the coveted Certified Financial Technician and Master of Financial Technical Analysis qualifications from the Interna


