NZD/USD Elliott Wave technical analysis [Video]
![NZD/USD Elliott Wave technical analysis [Video]](https://editorial.fxsstatic.com/images/i/NZDUSD-bullish-animal_XtraLarge.png)
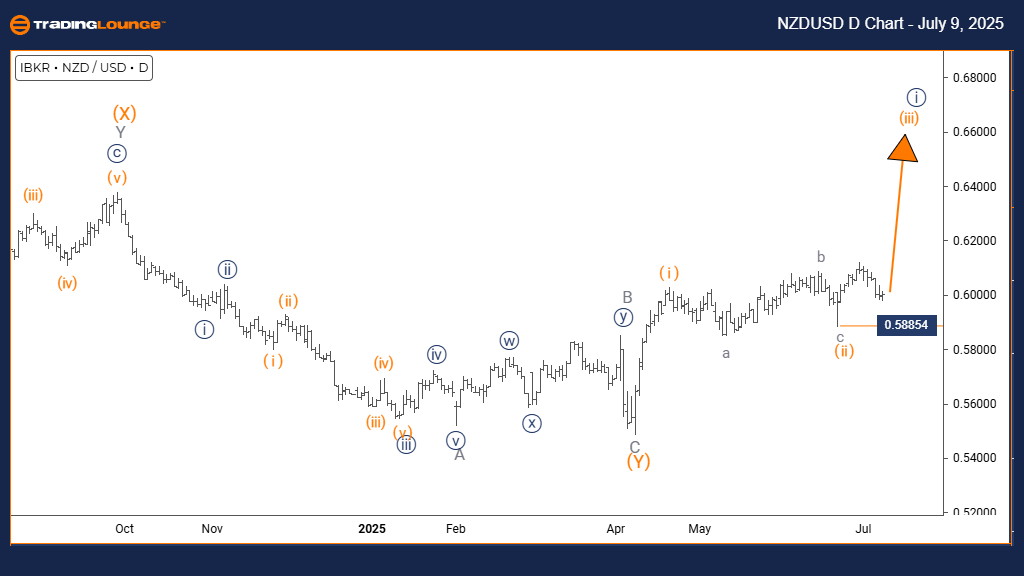
NZD/USD Elliott Wave technical analysis – Day chart
Function: Bullish Trend.
Mode: Impulsive.
Structure: Orange Wave 3.
Position: Navy Blue Wave 1.
Direction next lower degrees: Orange Wave 4.
Details: Orange Wave 2 appears complete; now Orange Wave 3 is progressing.
Wave cancel invalid level: 0.58854.
The NZDUSD daily chart indicates a bullish trend using Elliott Wave analysis. The price currently shows impulsive movement, aligning with wave 3 of the orange count. This entire structure is nested within navy blue wave 1, pointing to the start of a broader upward trend.
The next likely development is orange wave 4, expected to be a correction after the current wave 3. Indicators suggest orange wave 2 has ended, and the pair is now moving through orange wave 3—often the most powerful wave in an Elliott sequence. The impulsive behavior supports a strong bullish momentum, with sustained buying pressure leading the price action.
The invalidation level at 0.58854 is key. A break below this would invalidate the current Elliott count, hinting at a possible trend reversal. With the pair positioned in navy blue wave 1, this may mark the beginning of a prolonged bullish phase—provided the current wave structure holds. Traders may favor a positive outlook while prices remain above this level and await confirmation of continued impulsive activity.
When orange wave 3 completes, orange wave 4 is expected to follow as a corrective move. For now, the priority remains on tracking the continuation of wave 3. This daily timeframe is especially meaningful because it reflects broader market direction rather than short-term noise.
The ongoing wave 3 often includes the strongest and most extended movements in Elliott analysis. As the trend progresses, market watchers should monitor price levels closely. This structure highlights both opportunities and critical price zones that could shape near-term decisions.
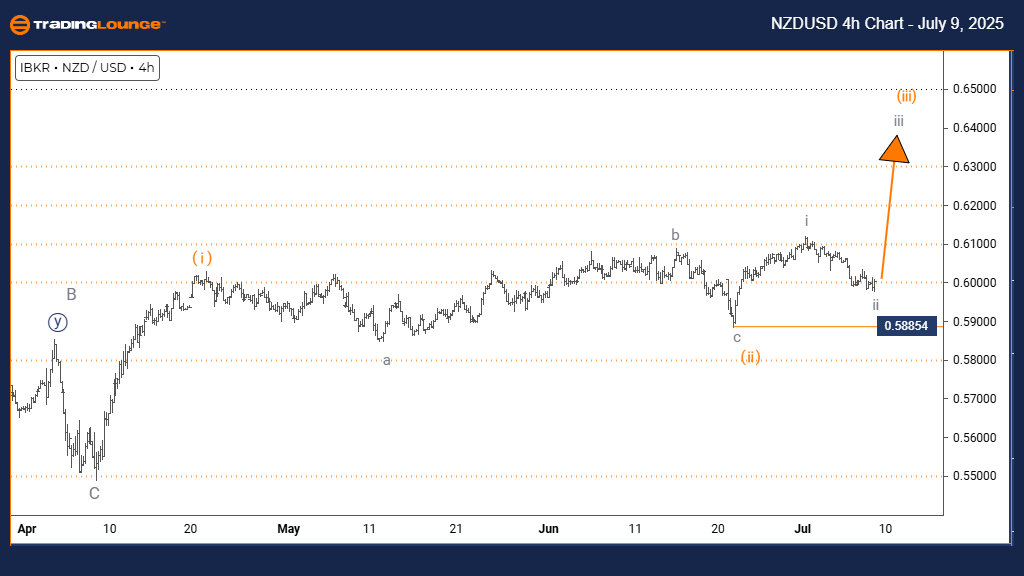
NZD/USD Elliott Wave technical analysis – Four-hour chart
Function: Bullish Trend.
Mode: Impulsive.
Structure: Gray Wave 3.
Position: Orange Wave 3.
Direction next higher degrees: Gray Wave 3 (Started).
Details: Gray Wave 2 seems complete; Gray Wave 3 is now in motion.
Wave cancel invalid level: 0.58854.
The 4-hour chart for NZDUSD signals a bullish trend using Elliott Wave principles. The price is currently moving in an impulsive pattern, identified as gray wave 3. This structure unfolds within orange wave 3, suggesting strong upward energy in the market. It also points to the beginning of gray wave 3 at a higher degree.
Gray wave 2 appears to have finished its corrective form, allowing the pair to enter gray wave 3—usually associated with high bullish momentum. The key invalidation level is marked at 0.58854. If the price falls below this level, the current wave structure would be invalid, indicating a shift in market direction. The current position in orange wave 3 is considered a powerful segment of the trend, often accompanied by strong and consistent buying interest.
As long as prices stay above the invalidation mark, a bullish stance remains justified, with traders awaiting additional signs that support continued wave advancement. The impulsive setup suggests the pair still has room to rise before facing significant resistance. In Elliott Wave terms, wave 3 often presents the sharpest price moves, making it vital for identifying trade opportunities.
Eventually, gray wave 4 should follow after the gray wave 3 peak. However, the immediate focus is on the expansion of the current impulsive movement. This analysis helps clarify NZDUSD's place within the larger trend and underlines the importance of monitoring price and wave activity near key levels.
In short, the 4-hour Elliott Wave analysis supports a bullish case for NZDUSD, with the pair pushing higher in a developing wave 3. Maintaining levels above 0.58854 keeps the bullish outlook intact. The conclusion of gray wave 2 has paved the way for a possible strong run, giving traders incentive to maintain long positions while the impulsive phase holds. The analysis highlights how critical it is to track wave structures and observe market reactions near crucial price points.
NZD/USD Elliott Wave technical analysis [Video]
Author

Peter Mathers
TradingLounge
Peter Mathers started actively trading in 1982. He began his career at Hoei and Shoin, a Japanese futures trading company.


