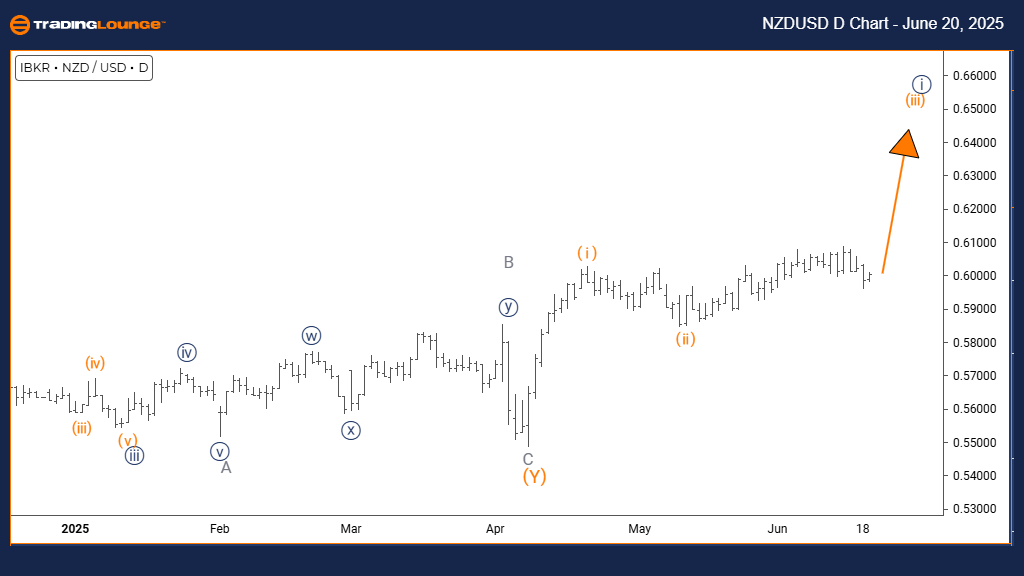
NZD/USD Elliott Wave technical analysis – Day chart

Function: Bullish Trend.

Mode: Impulsive.

Structure: Orange wave 3.

Position: Navy blue wave 3.

Direction next higher degrees: Orange wave 3 (started).

Details: Orange wave 2 appears completed; orange wave 3 is currently unfolding.

The NZDUSD daily chart Elliott Wave analysis indicates a bullish setup. Price action is advancing in impulsive mode, highlighting strong upward strength. The ongoing structure reflects orange wave 3, which is nested within a larger navy blue wave 3. This alignment suggests the currency pair is in a highly dynamic phase of its upward cycle, where third waves generally carry the most momentum.

The analysis points out that orange wave 2 has completed its correction, confirming the start of orange wave 3. This wave often leads to broad price increases due to its impulsive character. Traders should watch how orange wave 3 evolves within the wider navy blue wave 3 framework.

Current signals support a continuation of the bullish outlook. With orange wave 3 now active, the setup implies strong buying momentum and a high likelihood of further gains in upcoming sessions.

Chart

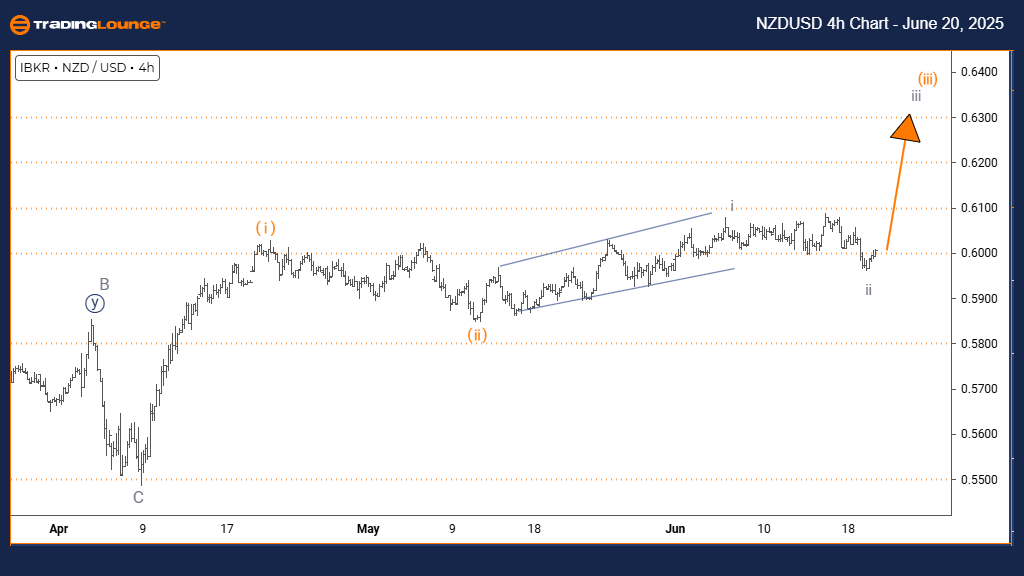
NZD/USD Elliott Wave technical analysis – Four-hour chart

Function: Bullish Trend

Mode: Impulsive

Structure: Gray wave 3

Position: Orange wave 3

Direction next higher degrees: Gray wave 3 (started)

Details: Gray wave 2 looks complete; gray wave 3 is in progress.

The NZDUSD 4-hour chart Elliott Wave analysis confirms a bullish trend. Price movement is currently in impulsive mode, reflecting upward momentum. The present pattern identifies gray wave 3 as part of the broader orange wave 3 sequence. This setup indicates the pair is in a strong advancing phase within its overall bullish framework.

Gray wave 2 seems to have ended, giving way to the onset of gray wave 3. This wave often demonstrates powerful and sustained movement, making it critical in identifying long opportunities. Traders should continue monitoring gray wave 3 as it expands within the larger orange wave 3 pattern.

Technical indications suggest NZDUSD remains in an upward trajectory. With gray wave 3 active, buying pressure is evident, supporting the potential for continued price appreciation in the short to medium term.

NZDUSD

NZD/USD Elliott Wave technical analysis [Video]


As with any investment opportunity there is a risk of making losses on investments that Trading Lounge expresses opinions on.

Historical results are no guarantee of future returns. Some investments are inherently riskier than others. At worst, you could lose your entire investment. TradingLounge™ uses a range of technical analysis tools, software and basic fundamental analysis as well as economic forecasts aimed at minimizing the potential for loss.

The advice we provide through our TradingLounge™ websites and our TradingLounge™ Membership has been prepared without considering your objectives, financial situation or needs. Reliance on such advice, information or data is at your own risk. The decision to trade and the method of trading is for you alone to decide. This information is of a general nature only, so you should, before acting upon any of the information or advice provided by us, consider the appropriateness of the advice considering your own objectives, financial situation or needs. Therefore, you should consult your financial advisor or accountant to determine whether trading in securities and derivatives products is appropriate for you considering your financial circumstances.

Recommended Content


Recommended Content

Editors’ Picks

Bitcoin sits at new record highs above $122,000

Bitcoin sits at new record highs above $122,000

Bitcoin breaks above the key milestone level on Monday, setting a new all-time high above $122,000, with no signs of slowing. The technical outlook supports further gains as momentum indicators remain robust and price action firmly in price discovery mode, with the next potential target above $130,000.

EUR/USD keeps the red below 1.1700 amid US-EU trade tensions

EUR/USD keeps the red below 1.1700 amid US-EU trade tensions

EUR/USD remains in the red below 1.1700 in the European session on Monday. The Euro underperforms against the US Dollar, in the wake of rising risks of a US-EU trade war, especially after US President Trump threatened 30% tariffs on the EU from August 1. EU says its ready with retaliatory tariffs. 

Gold price flirts with multi-week top as safe-haven buying offsets modest USD strength

Gold price flirts with multi-week top as safe-haven buying offsets modest USD strength

Gold price trades with a positive bias for the fourth straight day and hovers near a three-week high during the European session on Monday. Traders might refrain from placing aggressive directional bets and opt to wait for US inflation figures. Meanwhile, trade war fears continue underpinning the bright metal. 

GBP/USD holds losses below 1.3500; vulnerable near multi-week low

GBP/USD holds losses below 1.3500; vulnerable near multi-week low

GBP/USD enters a bearish consolidation phase in European trading on Monday, holding losses below the 1.3500 mark. Looming trade concerns dent risk sentiment and boost the haven dmeand for the US Dollar at the expense of the higher-yieding Pound Sterling. 

Meme coins to watch as Bitcoin hits record high

Meme coins to watch as Bitcoin hits record high

Meme coins Bonk, Dogwifhat, and Floki are positioned to extend gains as the weekly recovery reaches crucial resistance levels. The meme coins gain bullish momentum on the back of Bitcoin’s (BTC) recovery run, hitting a new all-time high on Thursday. 

Best Brokers for EUR/USD Trading

Best Brokers for EUR/USD Trading

SPONSORED Discover the top brokers for trading EUR/USD in 2025. Our list features brokers with competitive spreads, fast execution, and powerful platforms. Whether you're a beginner or an expert, find the right partner to navigate the dynamic Forex market.

Majors

Cryptocurrencies

Signatures

Best Brokers of 2025