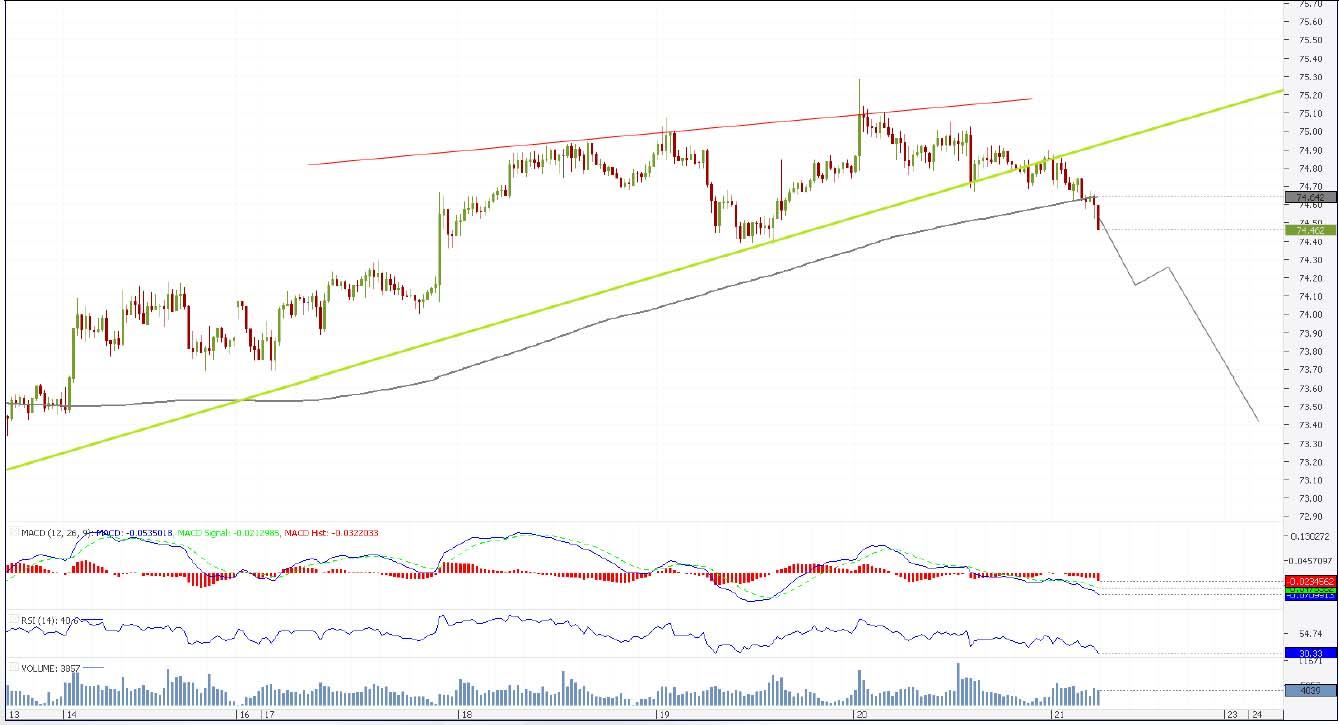
NZD/JPY 30M Chart: Rising Wedge

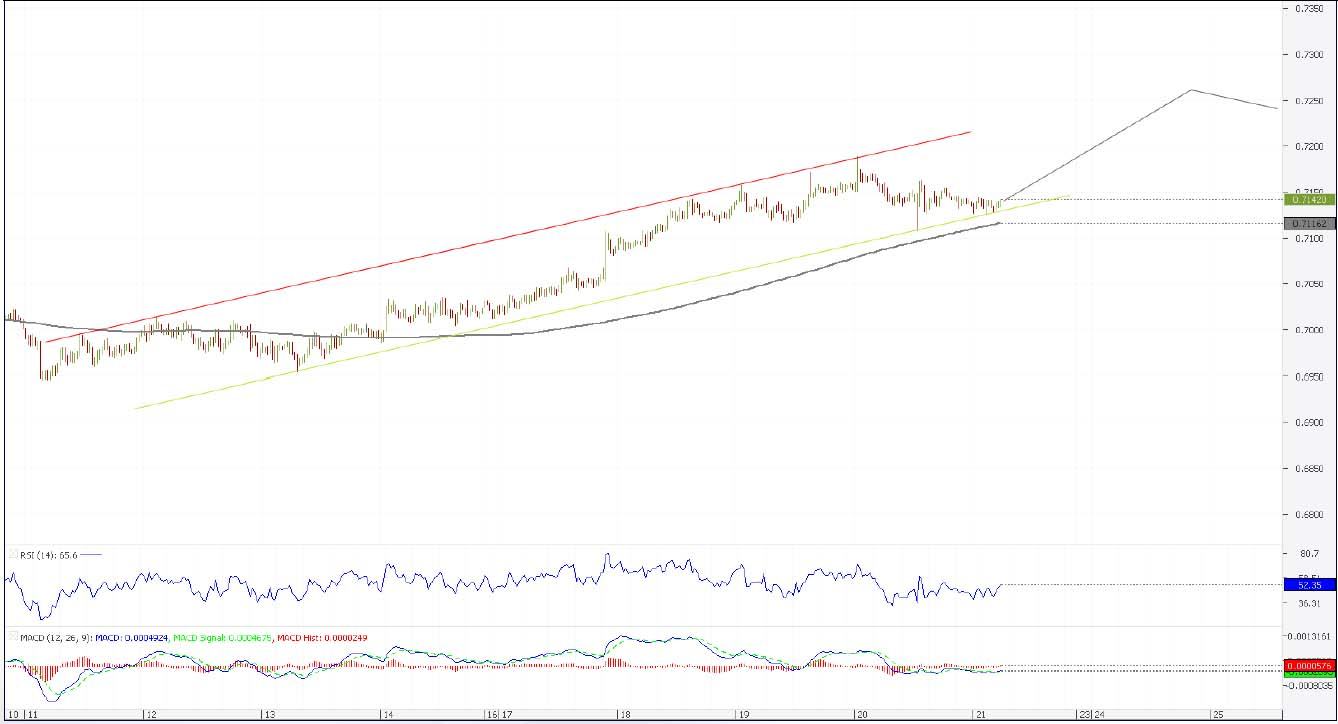
NZDCHF 30M Chart: Channel Up
Comment: Trading flat for the last two sessions, NZD/CHF tapped the bottom trend-line of the one and a half week channel and is about to trigger a surge in between the channel lines. Historically, we expect the pair to stick to the bottom trend-line for a while, as it did on the latest wave north. The flattish uptrend should emerge instantly or at 0.71156 with the immediate 0.7144/47 area working against it to maintain proximity to the trend-line. The rate will encounter just another level of significance (0.7187) on its way through the pattern, making it a relatively smooth lift. A break below the channel line would, however, result in a dip at least as low as 0.7116, but rather 0.7107/05.
NZD/JPY 30M Chart: Rising Wedge
Comment: NZD/JPY acted according to the scenario implied by the rising wedge, which emerged during the last few days and led to a dip below the bottom trend-line tonight. Following a retracement, the pair is currently pushing through the tough 74.55/50 area, and a close below would open the way to 74.30, the daily S2. Considering the significance of the broken trend-line and the certainty with which the 200-period SMA was violated, the pair could extend the weakness as low as 74.22, the monthly Pivot Point. There is, however, still hope for a return inside the wedge, as traders betting heavily on a falling New Zealand Dollar (74% positions are short) could elevate the rate towards equilibrium, setting eyes on 75.14/16 when inside the pattern.
Author

Dukascopy Bank Team
Dukascopy Bank SA
Dukascopy Bank stands as an innovative Swiss online banking institution, with its headquarters situated in Geneva, Switzerland.


