NZD/CHF 1H Chart: Falling Wedge

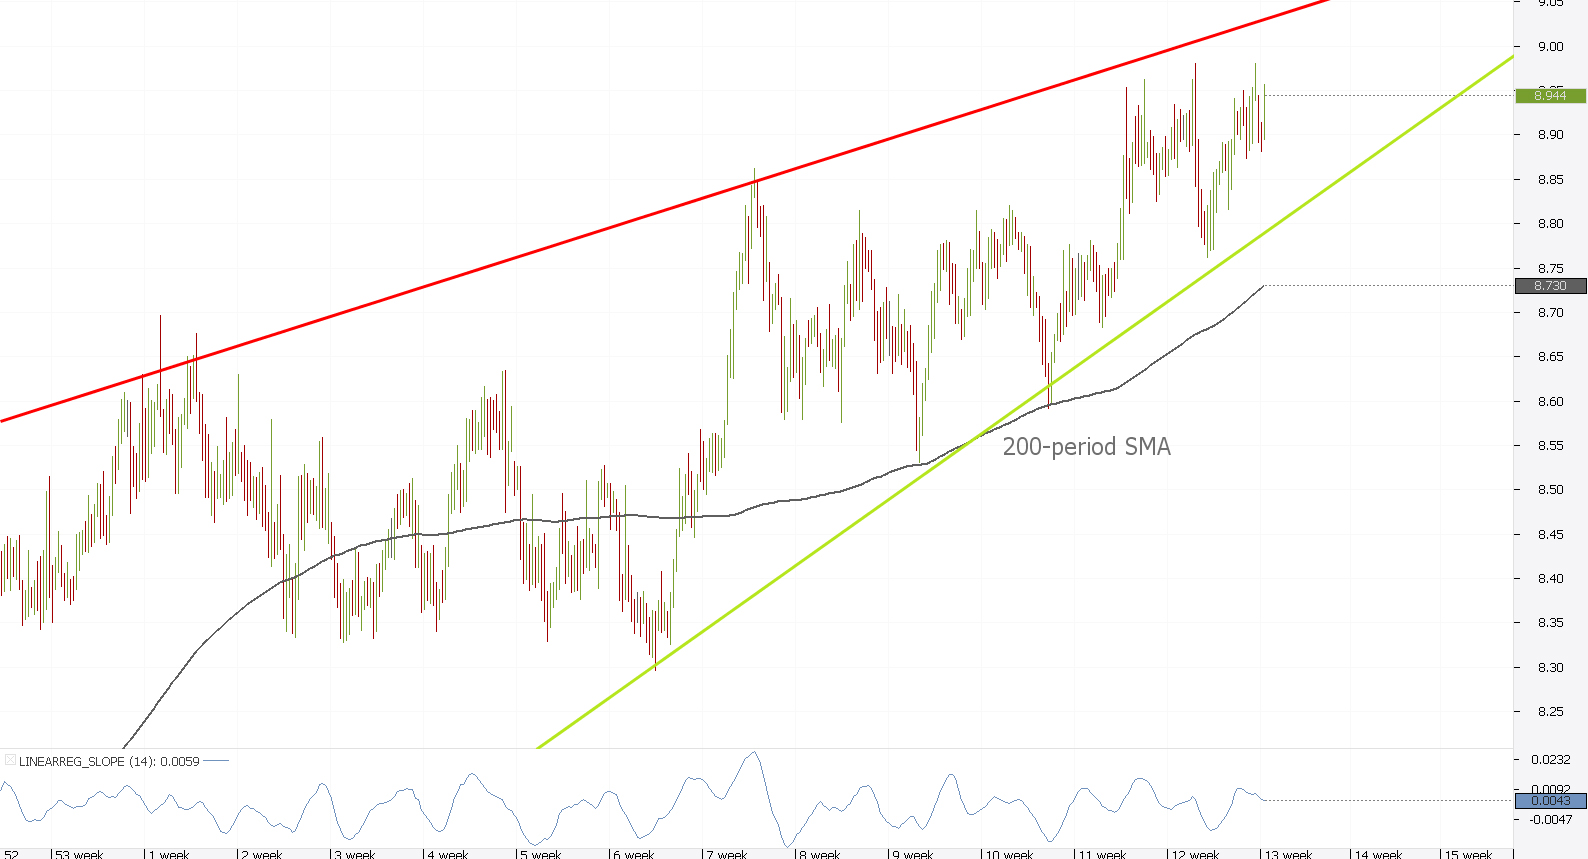
ZAR/JPY 4H Chart: Falling Wedge
Comment: ZAR/JPY managed to break the bearish trend in 2016 and established an upward-sloping trend-line on the daily chart, but has now lost amplitude for highs, suggesting that bears might once again take over the trend. The rate is currently making its way up towards the top bound of the wedge around 9.03, but will experience some hitches at 8.99 and 9.01. We will look for the pattern to eventually break to the downside, most likely after the current up-wave, and the stickiness of the bottom trend-line suggests the same.
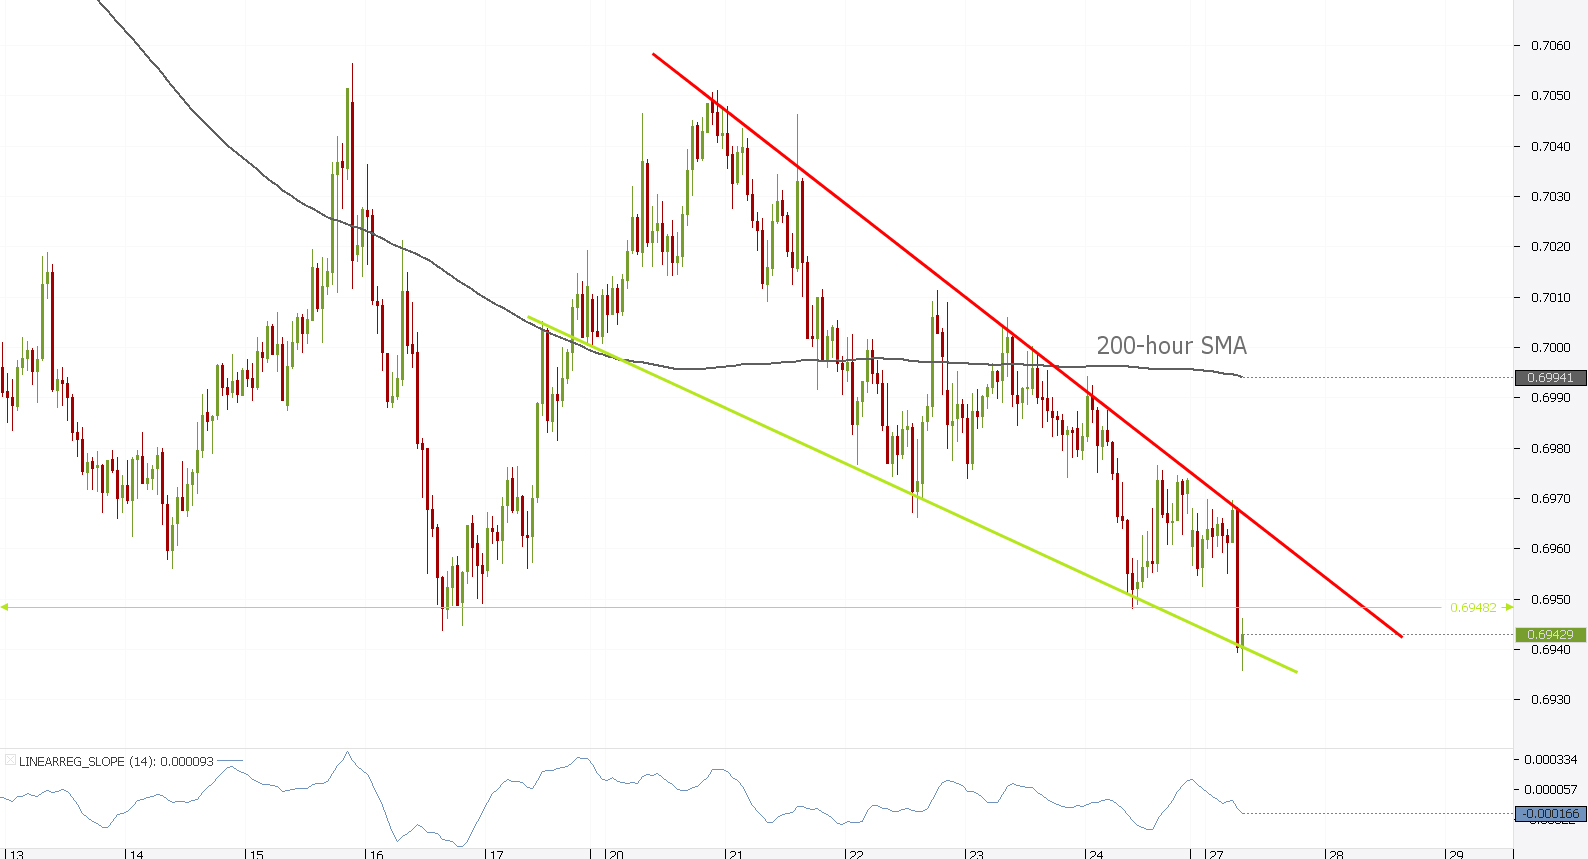
NZD/CHF 1H Chart: Falling Wedge
Comment: NZD/CHF had set a trading range with two test of the upper bound at 0.7051 and one at the bottom of 0.6948. The next attempt to test the area led to a break below, but it might not be conclusive due to a falling wedge that could send the pair skyrocketing again. The strong area has been broken in the last two hours and we would look for the pair to ultimately target the upper trend-line of the falling wedge at 0.6965 and then break above the area. We might see some flatness in the motion, because of the multiple levels on the way.
Author

Dukascopy Bank Team
Dukascopy Bank SA
Dukascopy Bank stands as an innovative Swiss online banking institution, with its headquarters situated in Geneva, Switzerland.


