NZD breaks 71c - will stats come to the rescue?

Plummeting by just under 8% in under seven sessions (as of yesterdays close), the Kiwi dollar is falling like the flightless bird it is named after.
It’s the renewed confidence in the Fed’s trajectory which knocked NZD cleanly from its perch. Or to be more precise, the 0.7176-0.7435 range it had spent the best part of 2018 in. Still, we doubt NZ export companies will complain, and neither will RBNZ who await higher inflation.
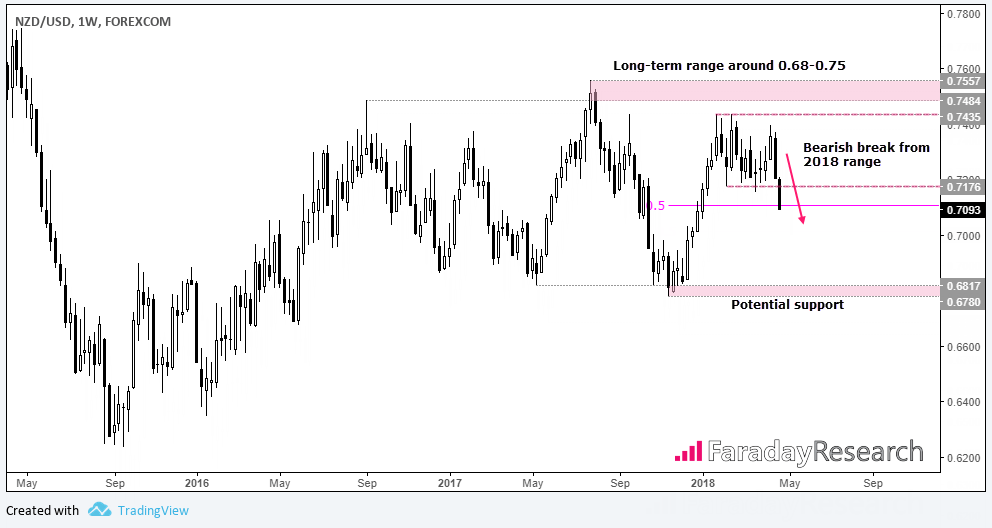
We can see on the weekly chart that bearish range expansion forced NZD to just below the 50% retracement between the 0.6780 low and 0.7435 high. Yet whilst the 0.71 handle showed a slight token of sympathy earlier today, bearish momentum seemingly has other ideas as it trades beneath 71c already. But if the break of 0.7100 is to be maintained it brings the wider 0.6800-0.7500 range into view, which leaves a lot of downside potential for bears with a seemingly unobstructed view. However, perhaps this impressive downslide could become its own downside, at least over the near-term.
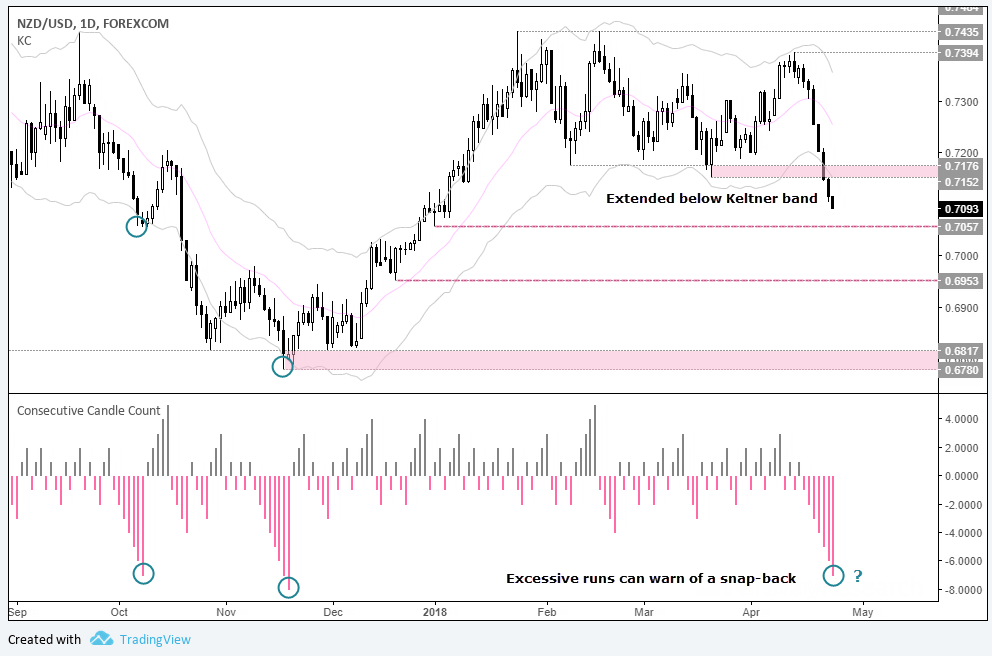
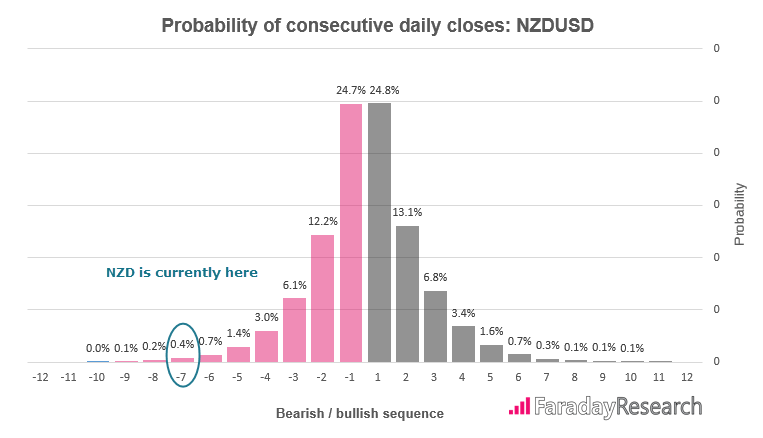
We can see on the daily chart that NZD currently trades beyond its lower Keltner band to warn of over-extension. Moreover, it may be fast approaching a statistical inflection point too as it’s now amidst its seventh consecutive bearish close. Using data from 1982 we estimate the probability of this event to be just 0.4% (or to put it another way, a 99.6% chance of today not closing lower). Furthermore, these probabilities go on to work against us the closer we get to 10 consecutive bearish days (which has only happened twice since 1982). It’s also worth noting that the ‘excessive’ bearish counts in October and November which are above five days preceded a retracement.
As technicals suggest over-extension and probabilities warn against betting on continued daily losses, we’d prefer to wait for a retracement before seeking a short entry. That’s not to say we won’t hit 0.7057 before an adequate retracement occurs, but we need some form of compression before we’d commit. And as higher timeframe momentum points lower, we’d be keen to explore shorts towards 0.7000 and 0.6953 whilst we remain below the 0.7152/76 resistant zone.
Author

Matt Simpson, CFTe, MSTA
CityIndex
Matt Simpson is a certified technical analyst who combines charts and fundamentals to generate trading themes.


