|

Nvidia is getting closer to a key resistance area

The Nvidia Corporation stock (NASDAQ: NVDA) traded higher on Tuesday, after it hit support at 464 on Monday. The rebound took the price slightly above the psychological zone of 500, which is also Friday’s high, but the move was cut short, with the stock pulling back near that psychological zone. Overall, the price structure on the 4-hour chart remains of lower peaks and lower troughs and thus, despite yesterday’s recovery, we will take a somewhat-negative approach.

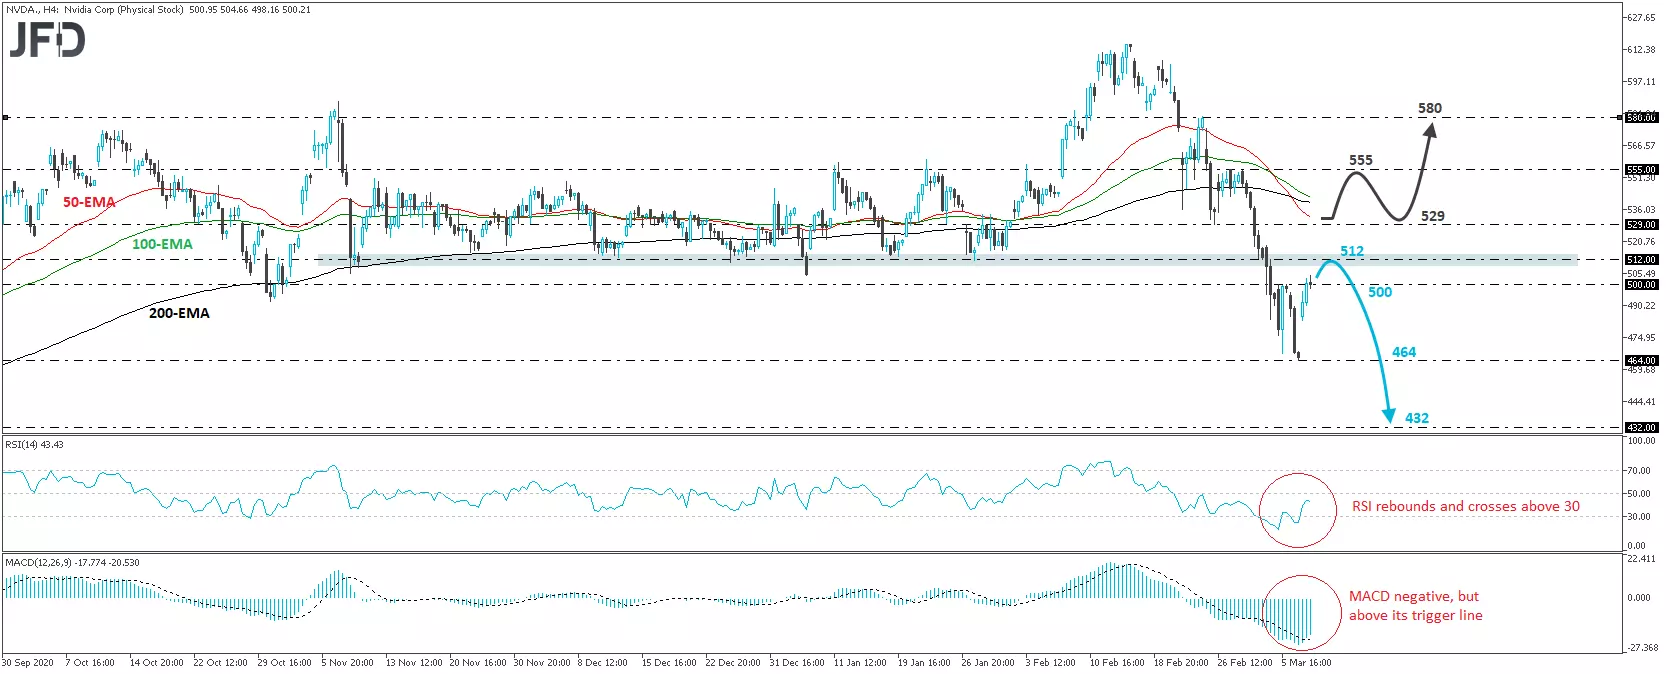
Even if Nvidia recovers a bit more, we see decent chances for the advance to stop near the key 512 resistance zone, which acted as a strong support between November 10th and January 27th. If investors decide to abandon the stock near that hurdle, we may see a slide back below 500, something that may open the way towards Monday’s low of 464. A break below 464 would confirm a forthcoming lower low and may set the stage for extensions towards the low of August 11th, at 432.

Shifting attention to our short-term oscillators, we see that the RSI, although it exited its below-30 zone and got closer to the 50 line, shows signs that it could turn down again. The MACD, although within its negative territory, remains above its trigger line still pointing up. The RSI suggests that the price may turn south again soon, but the MACD implies that we may see some more recovery before that, perhaps for a test near the aforementioned 512 zone.

Now, in order to start examining larger advances, we would like to see a clear move above 529, which is the inside swing low of February 25th. This may open the path towards the 555 hurdle, marked as a resistance by the highs of March 1st and 2nd, the break of which may see scope for extensions towards the peak of February 24th, at 580.

Chart

JFDBANK.com - One-stop Multi-asset Experience for Trading and Investment Services


Author

More from JFD Team
Share:

Editor's Picks

EUR/USD: US Dollar to remain pressured until uncertainty fog dissipates

Unimpressive European Central Bank left monetary policy unchanged for the fifth consecutive meeting. The United States first-tier employment and inflation data is scheduled for the second week of February. EUR/USD battles to remain afloat above 1.1800, sellers moving to the sidelines.

GBP/USD reclaims 1.3600 and above

GBP/USD reverses two straight days of losses, surpassing the key 1.3600 yardstick on Friday. Cable’s rebound comes as the Greenback slips away from two-week highs in response to some profit-taking mood and speculation of Fed rate cuts. In addition, hawkish comments from the BoE’s Pill are also collaborating with the quid’s improvement.

Gold: Volatility persists in commodity space

After losing more than 8% to end the previous week, Gold remained under heavy selling pressure on Monday and dropped toward $4,400. Although XAU/USD staged a decisive rebound afterward, it failed to stabilize above $5,000. The US economic calendar will feature Nonfarm Payrolls and Consumer Price Index data for January, which could influence the market pricing of the Federal Reserve’s policy outlook and impact Gold’s performance.

Week ahead: US NFP and CPI data to shake Fed cut bets, Japan election looms

US NFP and CPI data awaited after Warsh’s nomination as Fed chief. Yen traders lock gaze on Sunday’s snap election. UK and Eurozone Q4 GDP data also on the agenda. China CPI and PPI could reveal more weakness in domestic demand.

Three scenarios for Japanese Yen ahead of snap election

The latest polls point to a dominant win for the ruling bloc at the upcoming Japanese snap election. The larger Sanae Takaichi’s mandate, the more investors fear faster implementation of tax cuts and spending plans. 

XRP rally extends as modest ETF inflows support recovery

Ripple is accelerating its recovery, trading above $1.36 at the time of writing on Friday, as investors adjust their positions following a turbulent week in the broader crypto market. The remittance token is up over 21% from its intraday low of $1.12.