Now It’s NASDAQ’s Turn
US Dollar: Sept. USD is Down at 97.080.
Energies: Aug Crude is Up at 43.64.
Financials: The Sept 30 year bond is Up 5 ticks and trading at 157.02.
Indices: The Sept S&P 500 emini ES contract is 12 ticks Lower and trading at 2433.00.
Gold: The Aug gold contract is trading Up at 1251.00. Gold is 46 ticks Higher than its close.
Initial Conclusion
This is not a correlated market. The dollar is Down- and Crude is Up+ which is normal but the 30 year Bond is trading Higher. The Financials should always correlate with the US dollar such that if the dollar is lower then bonds should follow and vice-versa. The indices are Down and Crude is trading Up+ which is correlated. Gold is trading Up+ which is correlated with the US dollar trading Down-. I tend to believe that Gold has an inverse relationship with the US Dollar as when the US Dollar is down, Gold tends to rise in value and vice-versa. Think of it as a seesaw, when one is up the other should be down. I point this out to you to make you aware that when we don’t have a correlated market, it means something is wrong. As traders you need to be aware of this and proceed with your eyes wide open.
At this hour Asia is trading mainly Higher with the exception of the Indian Sensex and Hang Seng exchanges. All of Europe is trading Lower at this hour.
Possible Challenges To Traders Today
– S&P/CS Composite-20 HPI is out at 9 AM EST. This is major.
– CB Consumer Confidence is out at 10 AM EST. This is major.
– Richmond Manufacturing Index is out at 10 AM. This is major.
– FOMC Member Harker Speaks at 11:15 AM EST. This is major.
– Fed Chair Yellen Speaks at 1 PM EST. This is major.
– FOMC Member Kashkari Speaks at 5:30 PM EST. This is major.
Treasuries
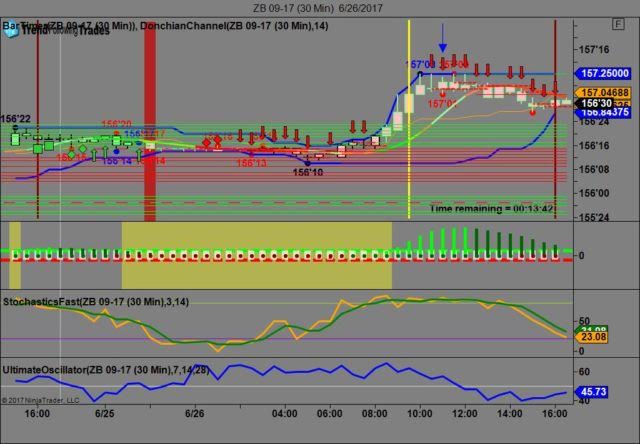
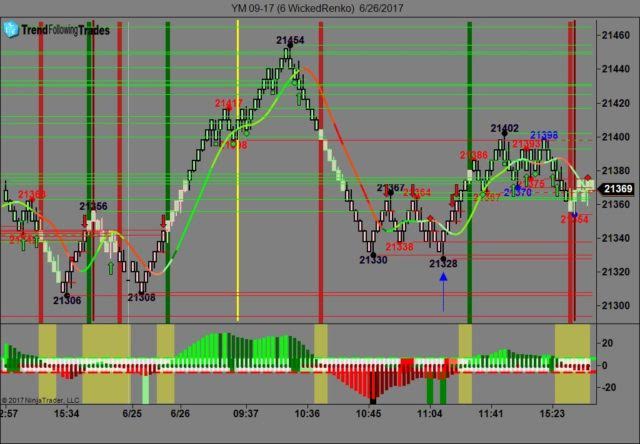
We’ve elected to switch gears a bit and show correlation between the 30 year bond (ZB) and The YM futures contract. The YM contract is the DJIA and the purpose is to show reverse correlation between the two instruments. Remember it’s liken to a seesaw, when up goes up the other should go down and vice versa.
Yesterday the ZB made it’s move at around 11 AM EST with no economic news in sight. The ZB hit a high at around that time and the YM hit a low. If you look at the charts below ZB gave a signal at around 11 AM and the YM was moving higher at the same time. Look at the charts below and you’ll see a pattern for both assets. ZB hit a high at around 11 AM and the YM hit a low. These charts represent the newest version of Trend Following Trades and I’ve changed the timeframe to a 30 minute chart to display better. This represented a shorting opportunity on the 30 year bond, as a trader you could have netted about 15 plus ticks per contract on this trade. Each tick is worth $31.25. We added a Donchian Channel to the charts to show the signals more clearly. Please note that the front month for the ZB contract is now September, 2017.
Charts Courtesy of Trend Following Trades built on a NinjaTrader platform.
Bias
Yesterday we gave the markets an upside bias as the USD, the Bonds and Gold were all trading lower yesterday morning. The Dow closed up 15 points the S&P by 1 but the Nasdaq traded lower by about 18 points. Today we aren’t dealing with a correlated market and our bias is to the downside.
Could this change? Of Course. Remember anything can happen in a volatile market.
Commentary
Yesterday we gave the markets an upside bias as we just followed our rules on Market Correlation which would suggest such a bias. The Dow traded higher but the Nasdaq took a slight dip. The Durable Goods numbers didn’t help much as they dropped from the month before. Additionally the CBO reports that under the Senate Health plan, 22 million Americans will lose coverage in the years to come. It is not yet known if the Senate will in fact call for a vote today as previously thought as there isn’t enough votes to pass legislation. Time will tell how this all works out…
Author

Nick Mastrandrea
Market Tea Leaves


