November 9: Stock market sell off and the Yen

NZDJPY, Daily
Most of the Yen crosses reversed to the Yen’s benefit, concomitantly with falling global stock markets in accordance with the Japanese currency’s usual inverse-correlative bias with equities.
The past 2 weeks, most of the Yen crosses have rallied amid a backdrop of strongly rebounding global stock markets. The temporary recession between on the US and China on trade, along with overall Earnings releases and firm US data have propelled Wall Street higher, while Chinese and Asian stocks, along with European markets, have rallied strongly as well. The biggest percentage gainers were the antipodean currencies, with RBA’s and RBNZ’s unchanged policy and upward revisions to their growth projections, were supporting the antipodeans further.
Today, however, things seems to change. The risk aversion flared up, with the stock market sell-off in Asian markets resumed and European stock markets are a sea of red. Meanwhile, concerns over the Chinese economy flared up as well, after RBA warned of risks from worsening trade war and a weaker Chinese economy. Also, China announced that it aims to boost large banks’ loans to private companies to at least 1/3 of company lending. Nikkei (JPN225) have lost -0.51%.
Hence the flagging stock markets across Asia, and the US, where the USA500 closed on Wall Street yesterday with a 0.25% loss, with futures of the index showing a further 0.3% decline, have been supporting the Yen and weakening the rest of the major currencies.
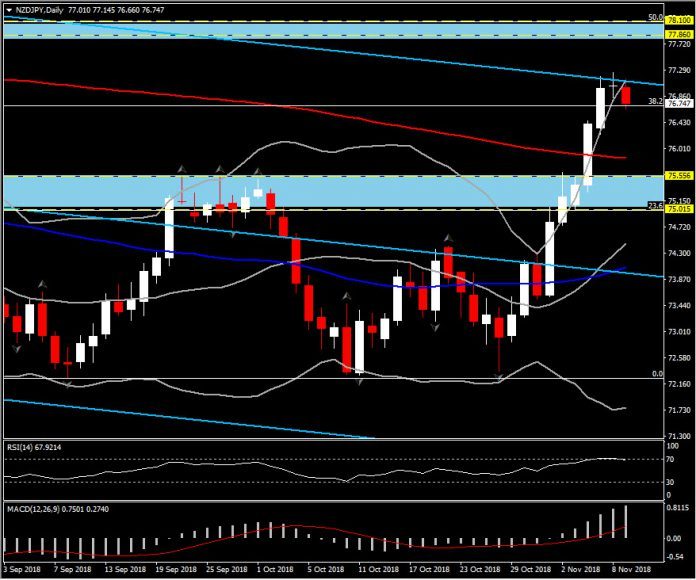
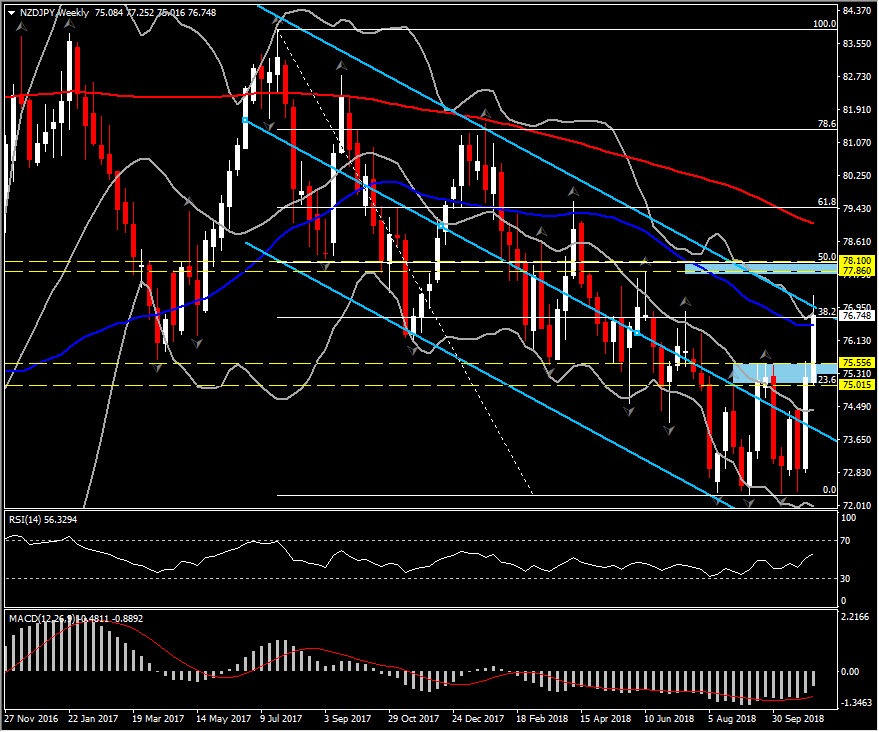
NZDJPY slipped to the 76.66 level after failing to sustain gains for a 3rd day above 77.00 level. The 77.00 barrier coincides with the up trendline of the bearish linear Regression Channel that the pair follows since July 2017. The indecision seen yesterday (doji candle), along with the southwards move today, suggest that bulls are struggling to make a breakout. Therefore in the medium term, 77.00 Resistance characterises a strong hurdle, which if it breaks, it could confirm a retest of 77.86-78.10 area, which reflects to 5-month peak and the 50% Retracement level since 2-year high.
Oppositely, based on today’s decline, a closing today below yesterday’s low, with a strong bearish candle, could turn the outlook to a negative one. In case the doors for the continuation of the downtrend open again, next Support area for NZDJPY in the medium term comes between 75.00-75.55 (the area between the 3 consecutive daily up fractals and the round level at the 23.6% fib.level).
Technically, the bullish picture remains, as MACD lines are increasing above signal line and neutral zone. The daily RSI, on the other hand, reached overbought barrier, but looks to the downside, presenting near-term weakness.
Author

Having completed her five-year-long studies in the UK, Andria Pichidi has been awarded a BSc in Mathematics and Physics from the University of Bath and a MSc degree in Mathematics, while she holds a postgraduate diploma (PGdip) in


