No Stim Package [Video]
![No Stim Package [Video]](https://editorial.fxstreet.com/images/Markets/Commodities/Metals/Gold/safe-investment-gm147322399-17568598_XtraLarge.jpg)
US Dollar: June USD is Down at 102.175.
Energies: April'20 Crude Up at 24.27.
Financials: The June'20 30 year bond is Down 31 ticks and trading at 178.22.
Indices: The March S&P 500 emini ES contract is 424 ticks Higher and trading at 2326.50.
Gold: The April '20 Gold contract is trading Up at 1620.00. Gold is 524 ticks Higher than its close.
Initial Conclusion
This is not a correlated market. The dollar is Down- and Crude is Up+ which is normal and the 30 year Bond is trading Lower. The Financials should always correlate with the US dollar such that if the dollar is lower then bonds should follow and vice-versa. The S&P is Higher and Crude is trading Higher which is not correlated. Gold is trading Higher which is correlated with the US dollar trading Down. I tend to believe that Gold has an inverse relationship with the US Dollar as when the US Dollar is down, Gold tends to rise in value and vice-versa. Think of it as a seesaw, when one is up the other should be down. I point this out to you to make you aware that when we don't have a correlated market, it means something is wrong. As traders you need to be aware of this and proceed with your eyes wide open.
At this time all of Asia is trading Higher based on the news that the coronavirus is slowing in Europe. Currently all of Europe is trading Higher as well.
Possible Challenges To Traders Today:
-
Flash Manufacturing PMI is out at 9:45 AM. This is Major.
-
Flash Services PMI is out at 9:45 AM EST. This is Major.
-
Richmond Manufacturing Index is out at 10 AM EST. This is Major.
-
New Home Sales is out at 10 AM EST. This is Major.
Treasuries
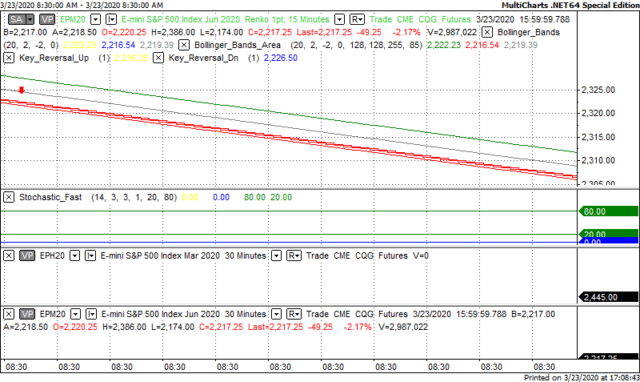
We've elected to switch gears a bit and show correlation between the 30 year bond (ZB) and The S&P futures contract. The S&P contract is the Standard and Poor's and the purpose is to show reverse correlation between the two instruments. Remember it's liken to a seesaw, when up goes up the other should go down and vice versa.
Yesterday the ZB made a move at around 8:30 AM EST. The ZB hit a Low at around that time and the S&P moved Lower. If you look at the charts below ZB gave a signal at around 8:30 AM and the S&P moved Lower at around the same time. Look at the charts below and you'll see a pattern for both assets. ZB hit a Low at around 8:30 AM EST and the S&P was moving Lower shortly thereafter. These charts represent the newest version of MultiCharts and I've changed the timeframe to a 15 minute chart to display better. This represented a Long opportunity on the 30 year bond, as a trader you could have netted 150 plus ticks per contract on this trade. Each tick is worth $31.25. Please note: the front month for the ZB is now June '20. The S&P contract is now June '20 as well. I've changed the format to Renko bars such that it may be more apparent and visible.
Charts Courtesy of MultiCharts built on an AMP platform
Bias
Yesterday we gave the markets a Downside bias as Gold, the USD and the Bonds were all trading Higher yesterday morning and this usually reflects a Downside day. The markets didn't disappoint as the Dow dropped 582 points and the other indices lost ground as well. Today we aren't dealing with a correlated market and our bias is to the Upside.
Could this change? Of Course. Remember anything can happen in a volatile market.
Commentary
Just when we thought we would a stimulus package to help us navigate the coronavirus conundrum we discover that no bill is forthcoming as the Senate cannot agree on what the bill should contain. The GOP like it as is and believe that by saving and helping businesses they will help secure jobs. Since when has there been job security in this country? We have seen that since the Reagan years. The Democrats on the other hand want more benefits for workers as they realize that when workers and consumers consume, the economy does well. Their argument is if you give this amount of money to a privileged few, it won't go anywhere and will be kept with the privileged few. Both parties have their points but clearly something must be done. Time will tell how it all works out...
Author

Nick Mastrandrea
Market Tea Leaves


