No Deal continues…[Video]
![No Deal continues…[Video]](https://editorial.fxstreet.com/images/Markets/Currencies/Majors/DollarIndex/financial-planning-calculator-twenties-1784220_XtraLarge.jpg)
US Dollar: June USD is Down at 97.115.
Energies: June '19 Crude is Down at 60.77.
Financials: The Jun 30 year bond is Down 7 ticks and trading at 149.08.
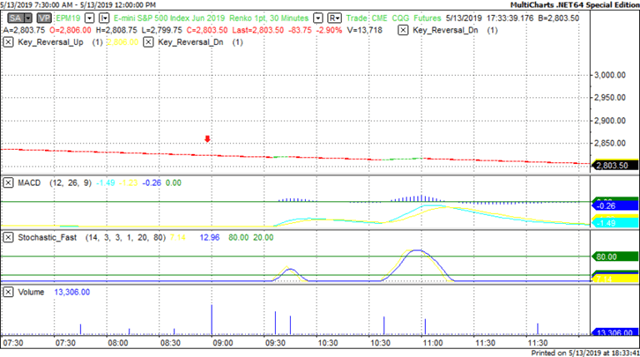
Indices: The June S&P 500 emini ES contract is 54 ticks Higher and trading at 2820.50.
Gold: The June Gold contract is trading Down at 1298.40. Gold is 38 ticks Lower than its close.
Initial Conclusion
This is not a correlated market. The dollar is Down- and Crude is Down- which is not normal and the 30 year Bond is trading Lower. The Financials should always correlate with the US dollar such that if the dollar is lower then bonds should follow and vice-versa. The S&P is Higher and Crude is trading Lower which is correlated. Gold is trading Lower which is not correlated with the US dollar trading Down. I tend to believe that Gold has an inverse relationship with the US Dollar as when the US Dollar is down, Gold tends to rise in value and vice-versa. Think of it as a seesaw, when one is up the other should be down. I point this out to you to make you aware that when we don't have a correlated market, it means something is wrong. As traders you need to be aware of this and proceed with your eyes wide open.
All of Asia traded mainly Lower with the exception of the Sensex which is trading higher. Conversely all of Europe is trading Higher.
Possible Challenges To Traders Today
-
NFIB Small Business Index at 6 AM EST. This is major.
-
Import Prices m/m is out at 8:30 AM EST. This is major.
-
Mortgage Delinquencies. This is major.
-
FOMC Member George Speaks at 12:45 PM. This is major.
Treasuries
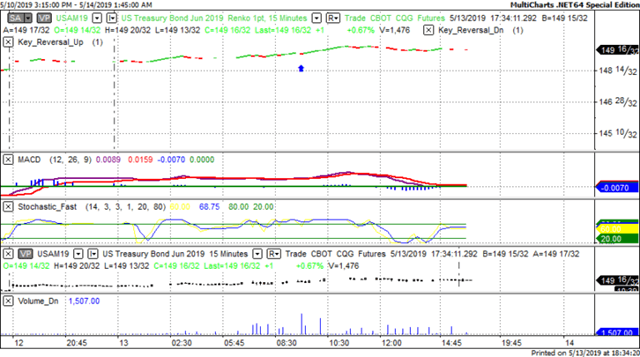
We've elected to switch gears a bit and show correlation between the 30 year bond (ZB) and The YM futures contract. The YM contract is the DJIA and the purpose is to show reverse correlation between the two instruments. Remember it's liken to a seesaw, when up goes up the other should go down and vice versa.
Yesterday the ZB made a major move at around 9:30 AM EST. The ZB hit a Low at around that time and the YM hit a High. If you look at the charts below ZB gave a signal at around 9:30 AM EST and the YM was moving Lower at the same time. Look at the charts below and you'll see a pattern for both assets. ZB hit a Low at around 9:30 AM and the YM was moving Lower at the same time. These charts represent the newest version of MultiCharts and I've changed the timeframe to a 15 minute chart to display better. This represented a Shorting opportunity on the 30 year bond, as a trader you could have netted about 15 ticks per contract on this trade. Each tick is worth $31.25. Please note: the front month for the ZB contract is now June, 2019 and I've changed the format to Renko bars such that it may be more apparent and visible.
Charts Courtesy of MultiCharts built on an AMP platform.
Bias
Yesterday we gave the markets a Neutral bias as it didn't have any direction yesterday morning. The Dow dropped 617 points and the other indices lost ground as well. Today we aren't dealing with a correlated market and our bias is to the Upside.
Could this change? Of Course. Remember anything can happen in a volatile market.
Commentary
Yesterday we perceived that there was an outside chance that the trade issue might be resolved between the US and China. Two weeks ago we were led to believe that this was a done deal and that an agreement would be forthcoming. Obviously this hasn't happened but the bigger question should be who's not telling the truth? Is it the Treasury Secretary or someone else? Now there's a 25% tariff on 200 billion dollars worth of Chinese goods and the Administration is threatening to include another 300 billion dollars wort of Chinese goods. The operative word is threatening. No one likes to be threatened and it doesn't who it is. Do you like someone who threatens you? Are you open to ideas and suggestions from someone threatening you? I'm not, are you?? Now the Federal Reserve is starting to line up and we can only wonder what they're thinking. Interest rate hike?? Only time will tell...
Author

Nick Mastrandrea
Market Tea Leaves


