No Attack Doesn’t Move Markets
US Dollar: Sept USD is Down at 95.550.
Energies: July '19 Crude is Up at 57.84.
Financials: The Sept 30 year bond is Up 20 ticks and trading at 155.07.
Indices: The Sept S&P 500 emini ES contract is 30 ticks Higher and trading at 2958.00.
Gold: The Aug Gold contract is trading Up at 1410.30. Gold is 102 ticks Higher than its close.
Initial Conclusion
This is not a correlated market. The dollar is Down- and Crude is Up+ which is normal but the 30 year Bond is trading Higher. The Financials should always correlate with the US dollar such that if the dollar is lower then bonds should follow and vice-versa. The S&P is Higher and Crude is trading Higher which is not correlated. Gold is trading Higher which is correlated with the US dollar trading Down. I tend to believe that Gold has an inverse relationship with the US Dollar as when the US Dollar is down, Gold tends to rise in value and vice-versa. Think of it as a seesaw, when one is up the other should be down. I point this out to you to make you aware that when we don't have a correlated market, it means something is wrong. As traders you need to be aware of this and proceed with your eyes wide open.
All of Asia traded Higher with the exception of the Sensex and Singapore exchanges which are Lower at this time. Currently all of Europe is trading Lower.
Possible Challenges To Traders Today
-
No major economic news.
-
Lack of major economic news.
Treasuries
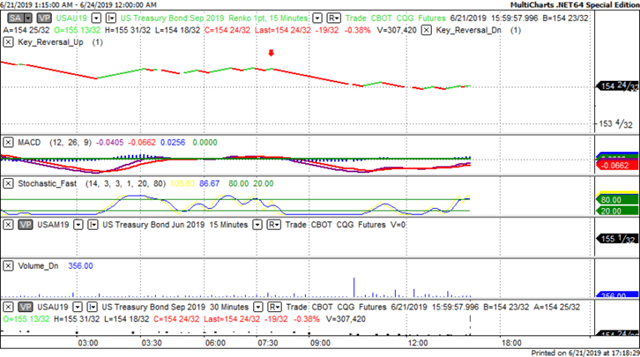
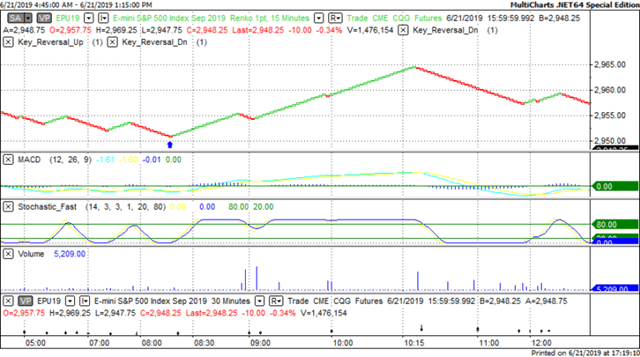
We've elected to switch gears a bit and show correlation between the 30 year bond (ZB) and The YM futures contract. The YM contract is the DJIA and the purpose is to show reverse correlation between the two instruments. Remember it's liken to a seesaw, when up goes up the other should go down and vice versa.
On Friday the ZB made a major move at around 8 AM EST. The ZB hit a High at around that time and the YM hit a Low. If you look at the charts below ZB gave a signal at around 8 AM EST and the YM was moving Higher at the same time. Look at the charts below and you'll see a pattern for both assets. ZB hit a High at around 8 AM and the YM was moving Higher at the same time. These charts represent the newest version of MultiCharts and I've changed the timeframe to a 15 minute chart to display better. This represented a Shorting opportunity on the 30 year bond, as a trader you could have netted about 20 plus ticks per contract on this trade. Each tick is worth $31.25. Please note: the front month for both the ZB and YM contract is now September, 2019 and I've changed the format to Renko bars such that it may be more apparent and visible.
Charts Courtesy of MultiCharts built on an AMP platform.
Bias
On Friday we maintained a Neutral bias as the indices didn't reflect any sense of direction. Every instrument was trading Lower Friday morning except crude. The Dow traded Lower by 34 points and the other indices traded Lower as well. Today we aren't dealing with a correlated market and our bias is Neutral.
Could this change? Of Course. Remember anything can happen in a volatile market.
Commentary
On Friday it was announced that the Administration "almost" launched a military strike against Iran as Iran had shot down an unmanned drone aircraft. Additionally it was announced that the deportation of illegal immigrants to the US that was supposed to take place this week has been postponed. Now there are a couple of trains of thought regarding this. First someone could say that the downing of any aircraft (either manned or unmanned) would constitute an act of war. The Iranians no doubt are celebrating this fact and their leader will claim this as a victory against the US. They should be mindful of what the US military did to their neighbor in Iraq...twice. From the US point of view it doesn't bode well for an administration to make a claim but not follow up on it. This administration could take a lesson from Chris Walken's Lion Speech.
Author

Nick Mastrandrea
Market Tea Leaves


