Hello fellow traders. In this technical blog we’re going to take a quick look at the past Elliott Wave charts of Nikkei published in members area of www.elliottwave-forecast.com. We’re going to explain the structure and see how we forecasted the path.

Let’s start by taking a look at Nikkei 4 hour chart from 04.05.217.  As we can see on the chart below, first leg from the 03/02 peak has ended as 5 waves structure. It’s labeld as A red.  On the 04/04 date we got break below A red and new short term low suggested that it’s not part of the same cycle anymore. Because of that , we labelled wave B red is done at 19316 high and as far as the price stays below that level, we should be in wave C red targeting 18589-17917 area. As the first leg has 5 waves structure, leg C red should be also in 5 waves.

Nikkei

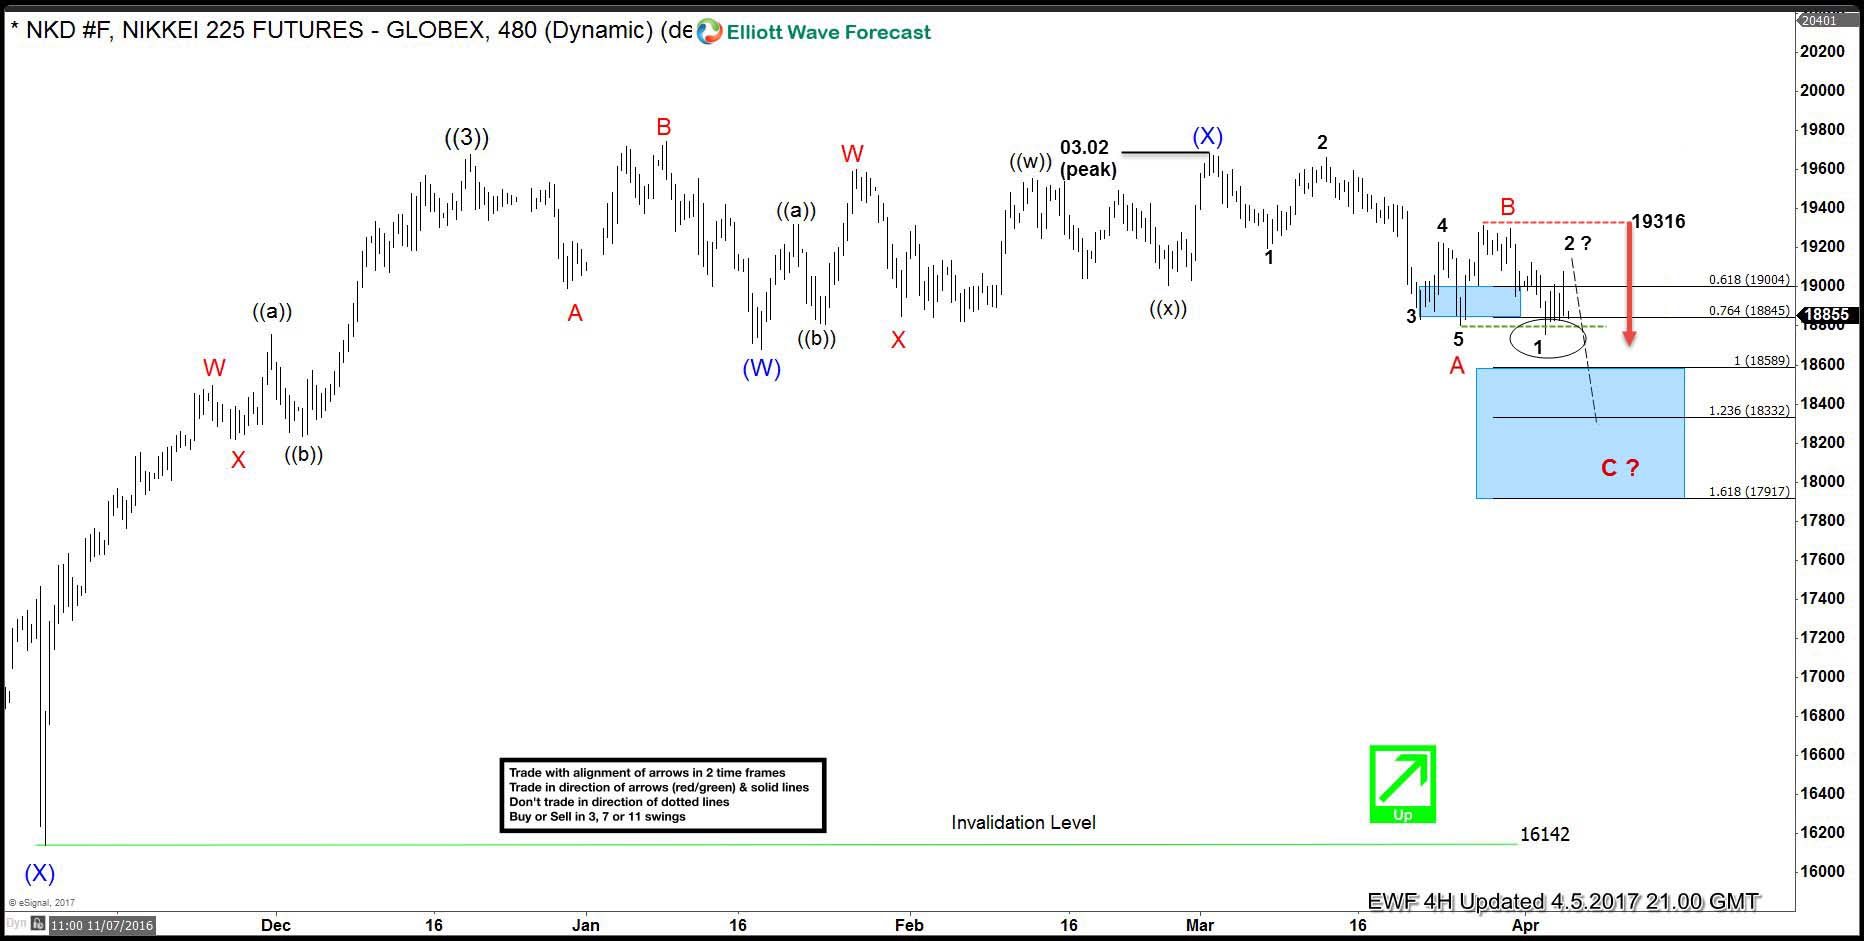
Now let’s take a look at the short term structure.

Nikkei Elliott Wave 1 Hour Chart 04/05 2017

Nikkei is bearish against the 19316 peak. Current view suggests the index is doing wave ((ii)) recovery which is unfolding as  double three elliott wave structure. We expect it to make another leg up in wave (y) of ((ii)) toward 19034-19100 area. At that zone sellers will be waiting for furhter decline toward proposed taget area: 18589-17917.

Nikkei

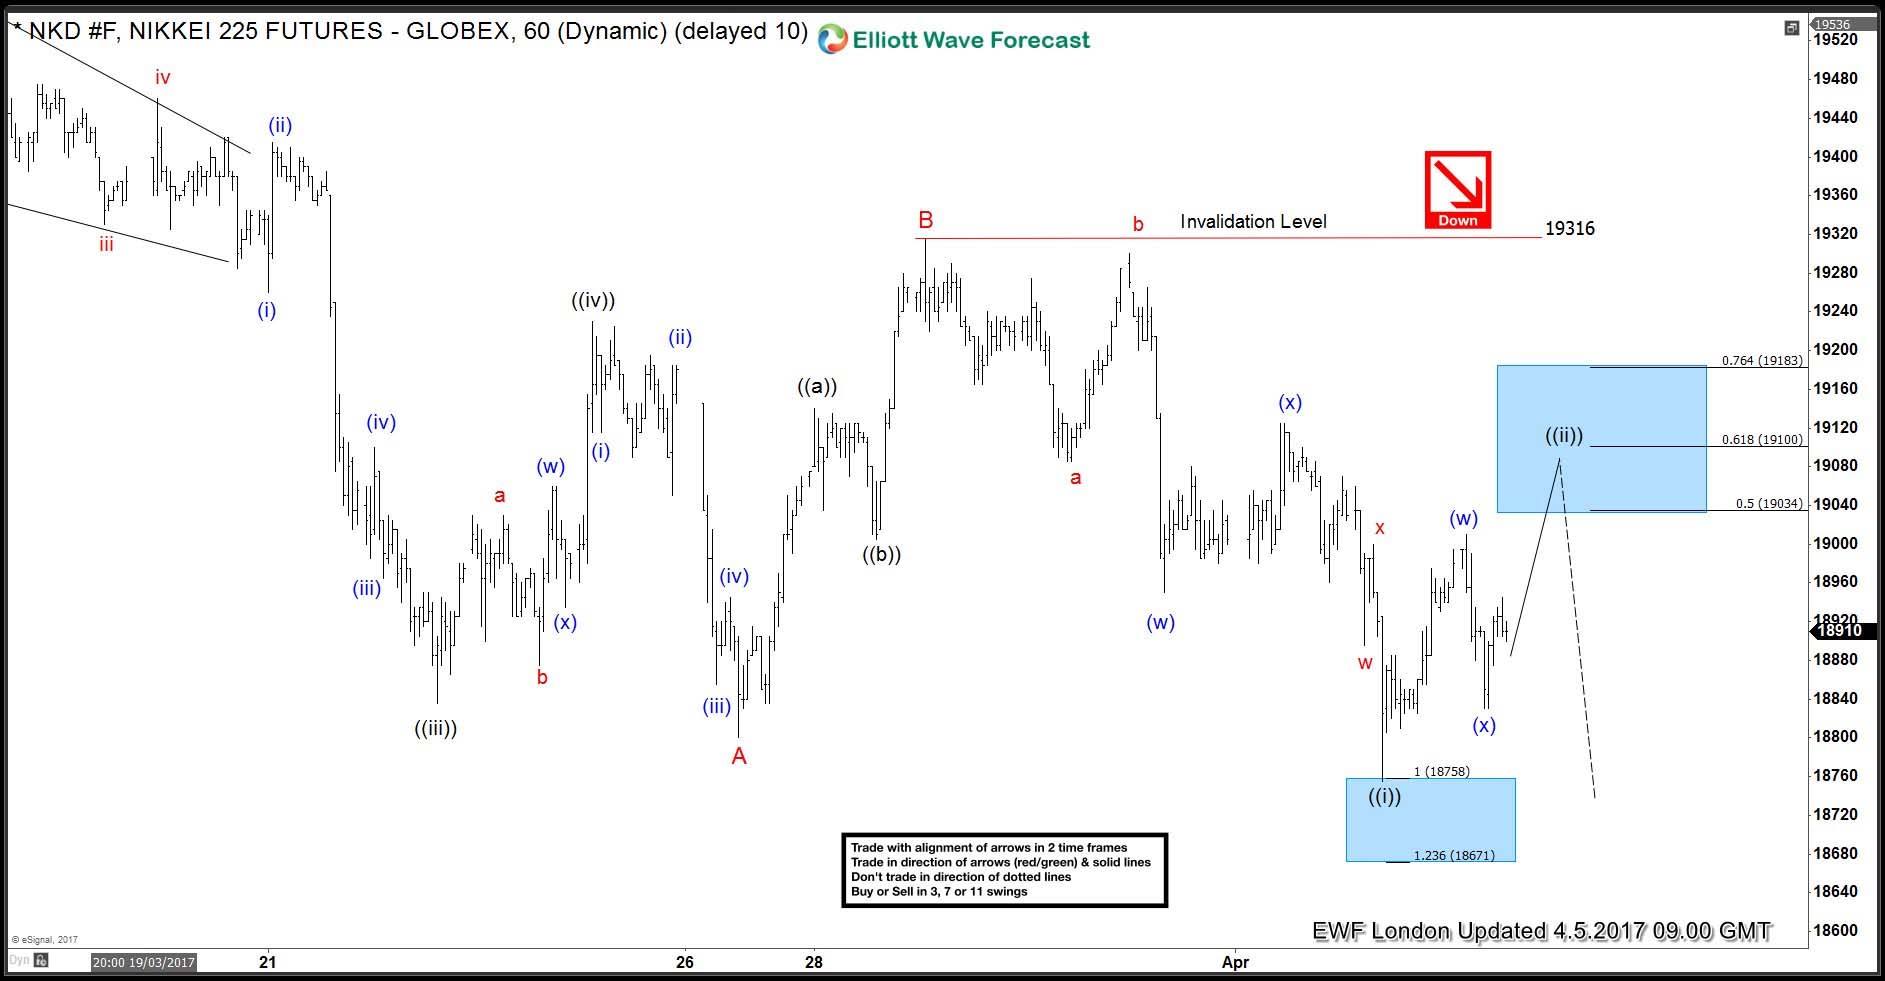
Eventually, the price has reached proposed blue box at 19034-19100, complete short term recovery, make decline toward new lows and reached the target at 18589-17917 . However there’s no any sign yet that cycle from the 03/02 peak is done yet.


Become a Successful Trader and Master Elliott Wave like a Pro. Start your Free 14 Day Trial at - Elliott Wave Forecast.

FURTHER DISCLOSURES AND DISCLAIMER CONCERNING RISK, RESPONSIBILITY AND LIABILITY Trading in the Foreign Exchange market is a challenging opportunity where above average returns are available for educated and experienced investors who are willing to take above average risk. However, before deciding to participate in Foreign Exchange (FX) trading, you should carefully consider your investment objectives, level of xperience and risk appetite. Do not invest or trade capital you cannot afford to lose. EME PROCESSING AND CONSULTING, LLC, THEIR REPRESENTATIVES, AND ANYONE WORKING FOR OR WITHIN WWW.ELLIOTTWAVE- FORECAST.COM is not responsible for any loss from any form of distributed advice, signal, analysis, or content. Again, we fully DISCLOSE to the Subscriber base that the Service as a whole, the individual Parties, Representatives, or owners shall not be liable to any and all Subscribers for any losses or damages as a result of any action taken by the Subscriber from any trade idea or signal posted on the website(s) distributed through any form of social-media, email, the website, and/or any other electronic, written, verbal, or future form of communication . All analysis, trading signals, trading recommendations, all charts, communicated interpretations of the wave counts, and all content from any media form produced by www.Elliottwave-forecast.com and/or the Representatives are solely the opinions and best efforts of the respective author(s). In general Forex instruments are highly leveraged, and traders can lose some or all of their initial margin funds. All content provided by www.Elliottwave-forecast.com is expressed in good faith and is intended to help Subscribers succeed in the marketplace, but it is never guaranteed. There is no “holy grail” to trading or forecasting the market and we are wrong sometimes like everyone else. Please understand and accept the risk involved when making any trading and/or investment decision. UNDERSTAND that all the content we provide is protected through copyright of EME PROCESSING AND CONSULTING, LLC. It is illegal to disseminate in any form of communication any part or all of our proprietary information without specific authorization. UNDERSTAND that you also agree to not allow persons that are not PAID SUBSCRIBERS to view any of the content not released publicly. IF YOU ARE FOUND TO BE IN VIOLATION OF THESE RESTRICTIONS you or your firm (as the Subscriber) will be charged fully with no discount for one year subscription to our Premium Plus Plan at $1,799.88 for EACH person or firm who received any of our content illegally through the respected intermediary’s (Subscriber in violation of terms) channel(s) of communication.

Recommended Content


Recommended Content

Editors’ Picks

AUD/USD stands firm above 0.6500 with markets bracing for Aussie PPI, US inflation

AUD/USD stands firm above 0.6500 with markets bracing for Aussie PPI, US inflation

The Aussie Dollar begins Friday’s Asian session on the right foot against the Greenback after posting gains of 0.33% on Thursday. The AUD/USD advance was sponsored by a United States report showing the economy is growing below estimates while inflation picked up. The pair traded at 0.6518.

AUD/USD News

EUR/USD mired near 1.0730 after choppy Thursday market session

EUR/USD mired near 1.0730 after choppy Thursday market session

EUR/USD whipsawed somewhat on Thursday, and the pair is heading into Friday's early session near 1.0730 after a back-and-forth session and complicated US data that vexed rate cut hopes.

EUR/USD News

Gold soars as US economic woes and inflation fears grip investors

Gold soars as US economic woes and inflation fears grip investors

Gold prices advanced modestly during Thursday’s North American session, gaining more than 0.5% following the release of crucial economic data from the United States. GDP figures for the first quarter of 2024 missed estimates, increasing speculation that the US Fed could lower borrowing costs.

Gold News

Bitcoin price continues to get rejected from $65K resistance as SEC delays decision on spot BTC ETF options

Bitcoin price continues to get rejected from $65K resistance as SEC delays decision on spot BTC ETF options

Bitcoin (BTC) price has markets in disarray, provoking a broader market crash as it slumped to the $62,000 range on Thursday. Meanwhile, reverberations from spot BTC exchange-traded funds (ETFs) continue to influence the market.

Read more

US economy: Slower growth with stronger inflation

US economy: Slower growth with stronger inflation

The dollar strengthened, and stocks fell after statistical data from the US. The focus was on the preliminary estimate of GDP for the first quarter. Annualised quarterly growth came in at just 1.6%, down from the 2.5% and 3.4% previously forecast.

Read more

Majors

Cryptocurrencies

Signatures