NFP Preview: USD/JPY could test 108.13 if wage growth disappoints
US non-farm payrolls data due on Friday at 12:30 GMT is expected to show the US economy added 183K jobs in July vs. 222K jobs in June. The average hourly earnings are seen rising 0.3% m/m vs. 0.2% growth registered in June. The annualised growth is seen slowing slightly to 2.4% from 2.5%. The unemployment rate is seen falling to 4.3% from 4.4%.
Markets are bearish on the US dollar
Dollar Index hit a one-year low of 92.35 this week. Right from the start of the year, the greenback steadily lost its shine against major currencies. The primary reason being -
- Falling inflation expectations and a flatter yield curve... Partly due to speculation that the Fed would be slow with policy normalization
- Political chaos in Washington
- Trump’s failure to get things done
- Outflow of funds from US markets to European markets
What advance indicators say?
Wage growth may miss estimates
According To Glassdoor Local Pay Reports, pay growth slowed for the sixth consecutive month, down from the 1.5% revised pay growth recorded last month. Pay growth peaked in January 2017 at 3.1%. The annual median base pay in the United States grew 1.2 percent year over year (YOY) in July 2017 to $51,120.
Payrolls may miss disappoint expectations as-
- US ISM non-manufacturing employment index dropped to 53.6 in July vs. 55.8 last.
- The ADP report showed US companied added 178K jobs in July vs. 185K expected.
- The Consumer Confidence Index rose to 121.1 in July; the highest level since July 2001. Consumers said jobs were even more "plentiful" than last month's report, up to 34.1% from 32%.
- US jobless claims remained near 44-year low in July. The average of new claims over the past month, which gives a more stable picture of layoff trends, also fell slightly to 241,750.
- US ISM manufacturing employment index fell to 55.2 from 57.2 a month earlier.
- Jolts data - Job openings fell from near record high in May as companies hired the most people since 2004
Focus on wage growth
The Fed’s preferred measure of inflation - core PCE price index topped out at 1.8% in Feb and since then has been steadily losing weight, as can be seen on the chart below.
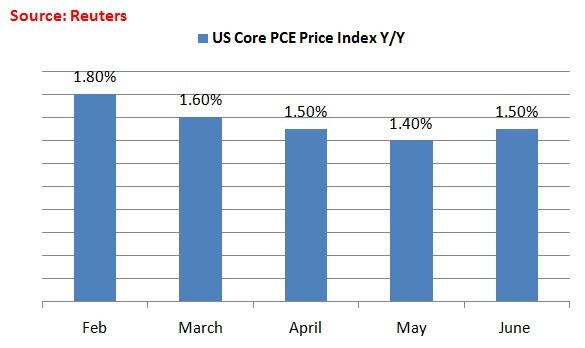
During the same time frame, the dollar index fell from the high of 102.26 to 92.55 levels. It is quite clear that the fate of the US dollar is tied to the US inflation print. The market is likely to ignore other negatives and boost the US dollar if the inflation shows signs of life,
Wage stagnation is a major problem as it pulls down demand pull inflation. It is to be noted that the wage growth slowdown is a phenomena seen across the globe. However, the Fed has already raised rates four times since December 2015. Now it intends to unwind its balance sheet…
Markets believe that the pace of the policy normalization from here on in would be extremely slow unless inflation sees a sustained rise.
The first signs of life would have to come through wage growth/wage price inflation. Hence, the focus is on wage growth numbers. A better-than-expected wage growth data could yield a much awaited technical rally in the USD. Meanwhile, one should not be surprised to see relentless USD selling gather pace again if the wage growth numbers disappoint.
NFP - A super strong data is bad news for USD…
A super strong NFP reading… let’s say above 220K or so would mean there is still considerable slack in the labor market and thus, rates need to remain low. Moreover, it would be the wrong time to hike rates at a faster rate when the labor pool is expanding. Hence, a big number could actually work against the USD bulls.
USD/JPY - higher lows likely on strong wage growth number
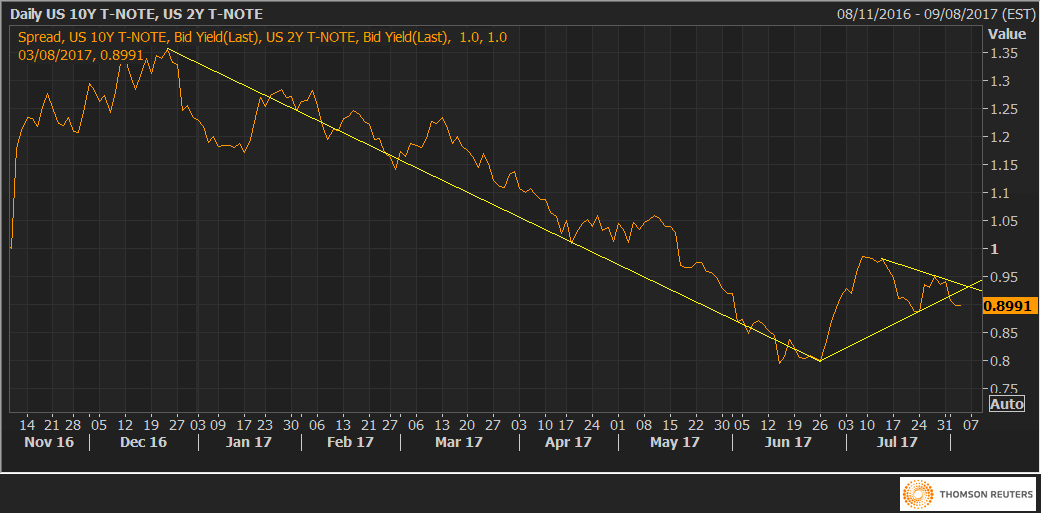
USD/JPY is trading around 11.00 levels and looks set to re-test 108.80 [June low] if we take into account the bearish breakdown on yield curve [difference between the US 10-yr yield and the 2-yr yield].
- Dollar loves a steeper yield curve
- Yield curve closely follows inflation expectations
Thus, it is quite clear that only a strong wage growth figure could result in a steeper yield curve and strengthen the US dollar.
Weekly chart
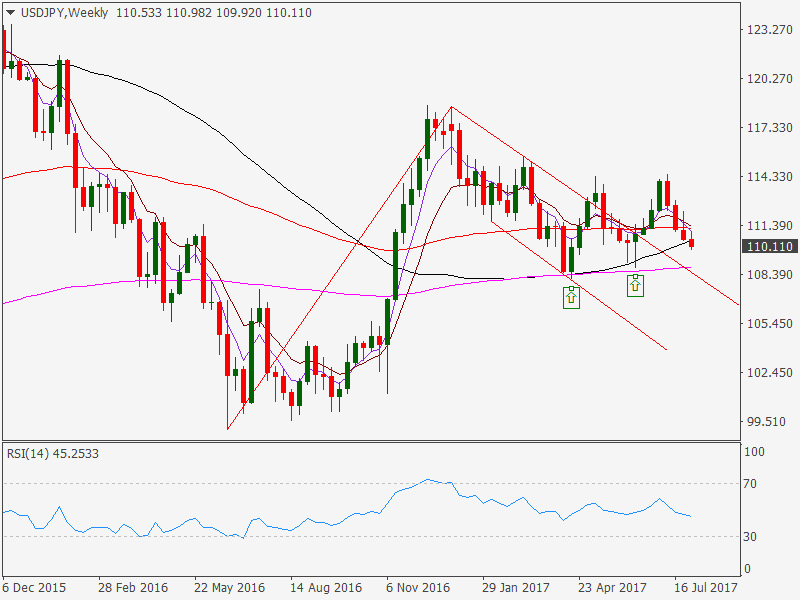
- The pair has formed higher lows - 108.13, 108.80 - on the monthly 50-MA, which has bottomed out and is sloping upwards.
- As of now, the spot is trading below its weekly 50-MA of 110.45.
- The pair could leave another higher low around the weekly 50-MA if wage growth figures print higher than expected. Such a move would open up upside towards 112.30
- On the other hand, a weaker-than-expected wage growth data would add credence to the bearish breakdown on the yield curve chart and open doors for a sell-off to 108.80-108.13 levels.
Yield curve [the difference between the US 10-yr yield and the 2-yr yield]
Author

Omkar Godbole
FXStreet Contributor
Omkar Godbole, editor and analyst, joined FXStreet after four years as a research analyst at several Indian brokerage companies.


