USD/JPY Forecast: Bears in charge as Treasury yield curve is set to flatten further

Dollar-Yen pair regained bid tone on Wednesday but failed to take out 110.98 [61.8% Fib R of 108.80 - 114.49]. The pair ended the day at 110.74 levels. The failure at the key Fib level could be blamed on the weaker-than-expected private sector job growth in the US as highlighted by the ADP report. Dow rose above 22K and ensured the losses in the USD/JPY pair in the aftermath of the weak ADP report were capped around 110.74 levels.
Treasury yield curve set to flatten
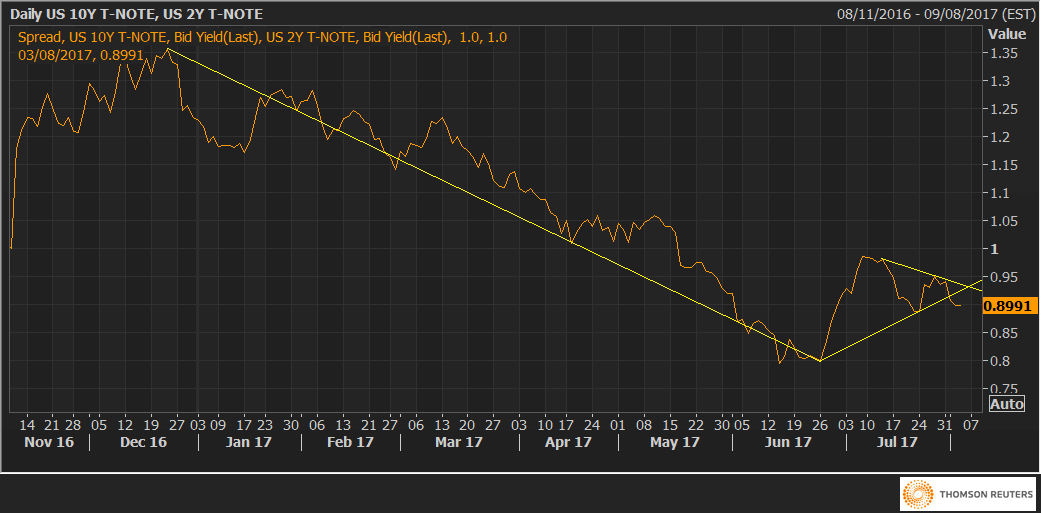
- The chart above represents the spread or the difference between the US 10-year Treasury yield and the 2-year Treasury yield.
- The bearish symmetrical pattern breakdown on the chart above indicates the difference/spread [yield curve] is set to flatten further.
- As discussed here, the American dollar responds positively to the steeper yield curve and vice versa.
- Hence, we may see the Dollar - Yen pair revisit the Aug low of 110.92.
Technicals - 10-DMA is strong hurdle
Resistance
- 110.98 [61.8% Fib R of 108.80-114.49 + 4-hour 50-MA] - 110.93 [10-DMA] - 111.00 [23.6% Fib R of 114.49 - 109.92]
- 111.41 [100-DMA]
- 111.65 [50-% Fib R of 108.80-114.49] - 111.67 [38.2% Fib R of 114.49-109.92]
Support
- 110.56 {5-DMA]
- 110.28 [support on 4-hour chart]
- 110.92 [Aug 1 low]
Observations
1-hour chart
-636373307659347052.png)
- 50-MA, 100-MA and 200-MA have bottomed out
- Higher low formation
4-hour chart
-636373307962555027.png)
- 50-MA has bottomed out; 100-MA is still sloping downwards
Daily chart
-636373308289141514.png)
- 5-DMA, 10-DMA still sloping downwards, 14-day RSI is bearish. Yesterday’s close was above 110.62 [July 24 low], however, we are yet to see a higher lows formation.
View
- Rally to 10-DMA or above cannot be ruled out, although such a move is likely to be met with fresh offers. The spot looks set to revisit 109.92 levels.
- An end of the day close below the same would signal continuation of the sell-off from the high of 114.49 and yield 109.11 [June 7 low].
- On the higher side, only an end of the day close above 10-DMA would signal the spot has bottomed out.
Author

Omkar Godbole
FXStreet Contributor
Omkar Godbole, editor and analyst, joined FXStreet after four years as a research analyst at several Indian brokerage companies.
More from Omkar Godbole


