NFP Doesn’t Wow Markets

Good Morning Traders,
As of this writing 4:30 AM EST, here’s what we see:
US Dollar: Dec. USD is Up at 100.945.
Energies: January Crude is Up at 51.96.
Financials: The Dec 30 year bond is Down 5 ticks and trading at 150.08.
Indices: The December S&P 500 emini ES contract is 47 ticks Higher and trading at 2203.75.
Gold: The December gold contract is trading Down at 1165.50.Gold is 123 ticks Lower than its close.
Initial Conclusion
This is not a correlated market. The dollar is Up+ and crude is Up+ which is not normal but the 30 year bond is trading Down. The Financials should always correlate with the US dollar such that if the dollar is lower then bonds should follow and vice-versa. The indices are Up and Crude is trading Up which is not correlated. Gold is trading Down which is correlated with the US dollar trading Up. I tend to believe that Gold has an inverse relationship with the US Dollar as when the US Dollar is down, Gold tends to rise in value and vice-versa. Think of it as a seesaw, when one is up the other should be down. I point this out to you to make you aware that when we don’t have a correlated market, it means something is wrong. As traders you need to be aware of this and proceed with your eyes wide open.
Asia traded mainly Lower with the exception of the Singapore and Sensex exchanges which traded Higher. As of this writing all of Europe is trading to the Upside.
Possible Challenges To Traders Today
– FOMC Member Dudley Speaks at 8:30 AM EST. This is major.
– Final Services PMI is out at 9:45 AM. This is major.
– ISM Non-Manufacturing PMI is out at 10 AM EST. This is major.
– Labor Market Conditions Index is out at 10 AM EST. This is not major.
– FOMC Member Bullard Speaks at 2:05 PM EST. This is major.
Treasuries
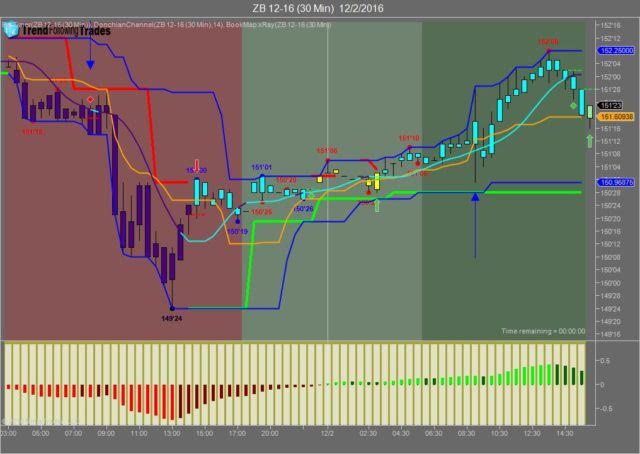
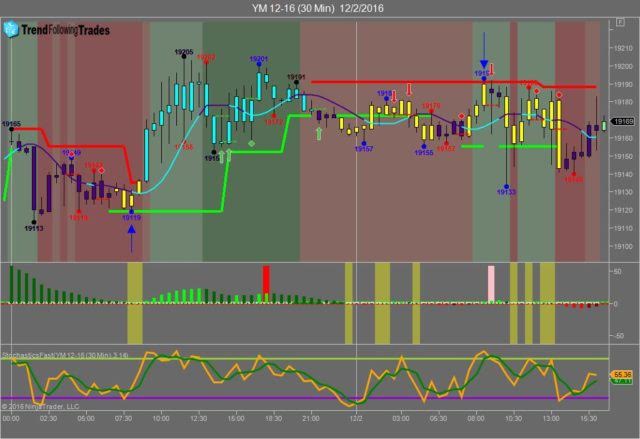
We’ve elected to switch gears a bit and show correlation between the 30 year bond (ZB) and The YM futures contract. The YM contract is the DJIA and the purpose is to show reverse correlation between the two instruments. Remember it’s liken to a seesaw, when up goes up the other should go down and vice versa.
Yesterday the ZB made it’s move at around 8:30 AM EST at around the same time that Non Farm Payrolls was reported. The ZB hit a low at around that time and the YM hit a high. If you look at the charts below ZB gave a signal at around 8:30 AM EST and the YM was moving lower at the same time. Look at the charts below and you’ll see a pattern for both assets. ZB hit a low at around 8:30 AM EST and the YM hit a high. These charts represent the newest version of Trend Following Trades and I’ve changed the timeframe to a 30 minute chart to display better. This represented a long opportunity on the 30 year bond, as a trader you could have netted about 30 plus ticks per contract on this trade. Each tick is worth $31.25. We added a Donchian Channel to the charts to show the signals more clearly.
Charts Courtesy of Trend Following Trades built on a NinjaTrader platform
Bias
On Friday we gave the markets a neutral bias as it was Jobs Friday and we always maintain a neutral bias on that day. The Dow traded lower by 22 points, the S&P gained less than 1 and the Nasdaq gained less than 5. All in all a neutral day to be sure. Today we aren’t dealing with a correlated market however our bias is to the upside.
Could this change? Of Course. Remember anything can happen in a volatile market.
Commentary
So the Non Farm Payrolls were released on Friday and if we were to look at the ADP numbers that came out on Wednesday and compare that to the NFP, we would see a disconnect. The ADP numbers came in at 216,000 new jobs created but the NFP came in at 178,000. The official unemployment rate is at 4.6% which we haven’t seen since August, 2007 (4 months before the Great Recession started). So you might be asking “well if all this is true, why didn’t the markets go much higher on Friday”? There are a few reasons for this. Whereas the number was positive, it wasn’t stellar. When you compare the actual (NFP) to the hypothetical (ADP) there’s a difference of about 50,000. Second, the market knows that the better the numbers are the more likely the Fed will raise later this month. Third, if the numbers were so great why is the U6 rate (long term unemployed) still at record highs? That rate is 9.3% versus 9.5% for October. The real reason isn’t because the actual unemployment rate is 4.6%, it’s because once someone is unemployed for longer than 12 months, the Department of Labor considers them to be “employed” with the idea being “well they must be doing something, so they’re employed.” I kid you not about this as it was related to me many years ago by a member of the DOL and he told me verbatim the same cooment I just said in quotation marks. I think the new Administration is going to have it’s hands full because the methods used by the DOL doesn’t necessarily reflect reality but then again time will tell if the new Administration wants reality or the bubble.
Author

Nick Mastrandrea
Market Tea Leaves


